Peter Smith

Dogecoin (DOGE) chart is catching the eye of crypto analysts once again. They're pointing to a repeating long-term pattern that has historically shown up before major rallies. Despite market downturns, the meme coin has maintained its strong community following and now appears to be consolidating for what could be another significant upward cycle.
The Pattern That Keeps Repeating
Recent technical analysis shows that Dogecoin continues forming higher lows on the weekly chart—a classic bullish signal that suggests buyers are consistently entering at increasingly elevated price points.
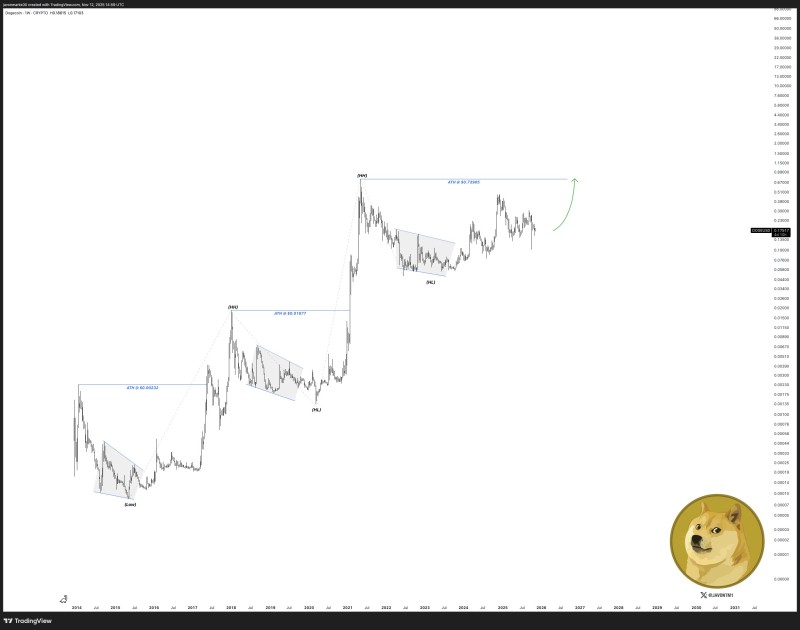
The chart tracks three distinct accumulation phases across multiple market cycles, each marked by tight consolidations and wedge-like corrections that historically led to substantial rallies.
Here's what previous phases delivered:
- The first phase saw prices climb from roughly $0.00023 to $0.017
- The second pushed from $0.017 all the way to $0.739
- Now Dogecoin appears to be entering a third similar zone, currently stabilizing between $0.12 and $0.18
If history repeats itself, the next major move could send DOGE toward that previous all-time high of $0.74, which would represent approximately 311% gains from current levels. The chart reinforces Dogecoin's consistent long-term structure of consolidation followed by exponential growth, and recent projections align with expectations of an upward continuation once this higher low formation completes.
What's Driving the Setup
Dogecoin's improving chart structure comes as broader crypto sentiment turns more positive. Bitcoin's stabilization above key support levels has boosted liquidity and risk appetite across altcoins. There's also ongoing speculation about potential integration of DOGE payments into X (formerly Twitter), which continues adding long-term appeal for investors. On-chain data shows steady accumulation by long-term holders, a pattern that's been consistent with previous pre-bull market phases for the asset.
 Peter Smith