 Peter Smith

⬤ Dogecoin keeps losing ground on the weekly chart, with DOGE now closing in on a significant technical zone. The asset is approaching the 0.786 Fibonacci retracement level around $0.167, which lines up with the tariff dip from April. DOGE is currently changing hands in the $0.13 to $0.15 range after a steady pullback from its 2025 peaks, still trapped below a clear descending trendline.
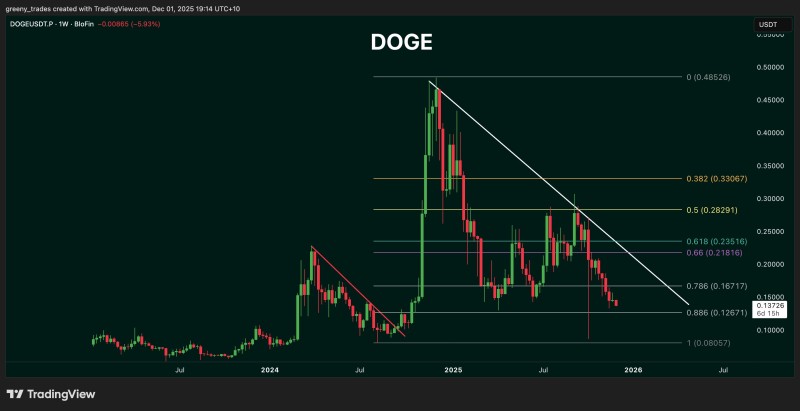
⬤ The weekly chart reveals that DOGE has steadily bled momentum since peaking near $0.48. Price has carved out a series of lower highs while tumbling through major Fibonacci levels. DOGE broke below the 0.5 level around $0.28, later punched through the 0.618 zone near $0.23, and is now testing the 0.786 area around $0.167. Previous bounces at these retracement zones only produced quick pauses rather than real reversals, showing weak buyer interest.
⬤ The bigger picture shows that DOGE hasn't broken free from its multi-month downward grind that's been in place since mid-2025. The descending resistance line keeps pushing back any rally attempts, pointing to cautious market sentiment. The 0.786 level gets extra attention because it matches the earlier tariff-driven dip seen in April, historically acting as a reaction zone. Any short-term bounce there would need confirmation, as the current trend still leans bearish unless price cracks above the declining resistance.
⬤ This matters for the wider crypto market because DOGE often sets the tone for sentiment in the meme coin space. Hitting a major Fibonacci zone during a long decline could shape short-term risk appetite across similar assets. How DOGE behaves at this support level will likely influence trading decisions in related tokens over the coming weeks.
 Peter Smith


