 Saad Ullah

⬤ Dogecoin just pushed through a key resistance level that's been holding it back for weeks. On the 2-hour chart, price finally climbed above the $0.132–$0.133 zone, breaking free from what had become a stubborn ceiling. What makes this move interesting is the clean inverse head and shoulders pattern that formed along the way—a left shoulder that appeared first, a deeper dip down to around $0.119–$0.120 for the head, and then a right shoulder that came in higher than the left one as buyers started stepping back in.
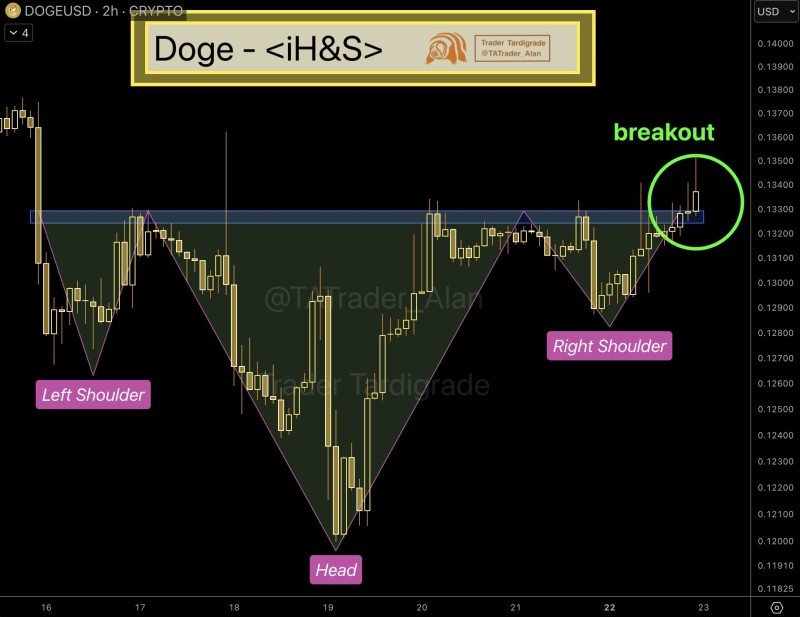
⬤ The neckline on this pattern did its job perfectly, acting as resistance over and over while both shoulders were forming. Price kept bumping into that same level and getting pushed back down until something finally shifted. Now that same neckline that used to block the way up is working as support underneath. The right shoulder didn't go as deep as the left one, which shows momentum starting to tip in favor of buyers. Recent price action is holding steady above that former resistance band instead of immediately getting rejected back down.
⬤ Inverse head and shoulders patterns typically show up when a downtrend or choppy sideways phase is running out of steam. Dogecoin spent quite a bit of time bouncing around unevenly before carving out that head at the bottom, then gradually building back up to form the right shoulder. The pattern looks textbook—clean neckline, proportional structure, no messy overlaps. It doesn't need a bunch of indicators to see what's happening here.
⬤ This matters because the broader crypto market has been seeing short-term rotations lately, and high-liquidity altcoins like Dogecoin tend to catch attention when sentiment shifts. DOGE moves fast when traders pile in, so technical setups like this can play out quickly. As long as price stays above that neckline zone, the bullish structure stays valid. Drop back below it, and the pattern loses its punch. Stay above, and the reversal scenario remains on the table.
 Saad Ullah


