 Saad Ullah

⬤ Dogecoin is defending a major weekly support area that's proven reliable over time. The latest market data shows $DOGE bouncing repeatedly from this same horizontal zone, with the weekly chart revealing consistent rebounds that have kept the structure solid. This level has consistently acted as a floor where the price finds stability.
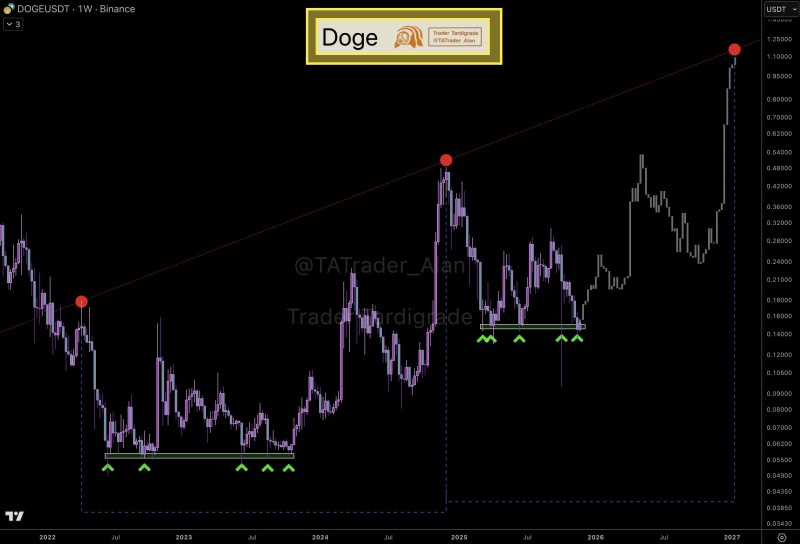
⬤ Historical data shows multiple touches of this support band, creating a pattern of higher lows within the same weekly range. A long-term diagonal trendline marks previous cyclical peaks above current price action, while recent movement stays comfortably above the lower boundary. Despite several pullbacks, Dogecoin hasn't broken this critical support, echoing earlier consolidation phases that led to upward moves.
⬤ This support zone has formed a multi-year pattern where accumulation happens at roughly the same level across different cycles. The current stabilization looks similar to earlier base-building periods before DOGE rallied toward higher targets. While no breakout is happening yet, the chart pattern shows this support zone remains active and relevant to the broader price cycle.
⬤ Why this matters: DOGE's long-term trajectory often hinges on how it handles major weekly levels that shape overall market sentiment. Holding this area preserves the higher-timeframe structure and keeps momentum potential alive if conditions improve. This stability matches the repeated historical behavior visible across multiple cycles.
 Saad Ullah


