 Eseandre Mordi

⬤ After weeks of decline, Dogecoin now hovers just above a major support zone and clings to its 200-week moving average. Long-term support and deeply oversold momentum gauges have started to draw eyes toward a possible change in the weekly chart structure. Price sits near $0.14, the level where buyers have already blocked further losses.
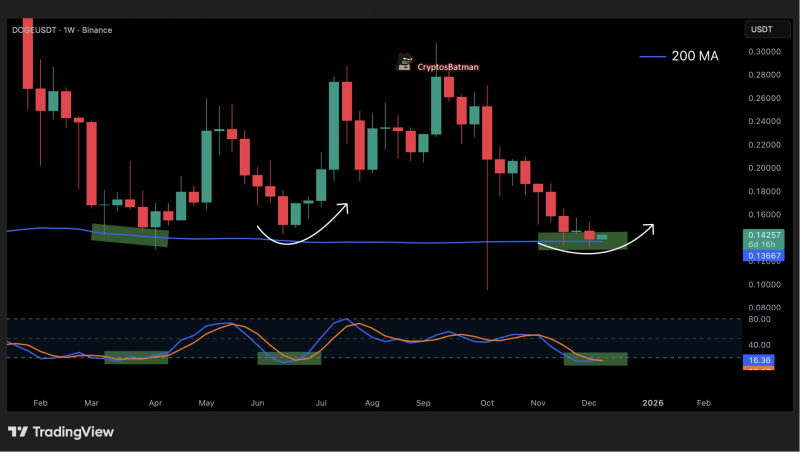
⬤ DOGE has returned to a historical support floor that sparked rallies earlier this year. The weekly chart displays a gentle rounding pattern above the 200-week MA, a line that has served as a repeated turning point. The Stochastic oscillator has slipped back into extreme oversread territory echoing the setup that preceded the last mid term rebound almost six months ago.
⬤ A long run of lower weekly candles has cooled sentiment - yet the fresh technical setup hints that selling pressure is fading. Each time the Stochastic has reached oversold extremes near the 200-week average, a rebound of some size has followed. No upward reversal has been locked in, but the current picture mirrors earlier accumulation phases that later rotated price higher.
⬤ The change matters because it may flag a broader return of risk appetite after Dogecoin's lengthy cooldown. Price action that clusters around long term moving averages often sways crowd behaviour and repeated oversold readings can tilt sentiment during key inflection points. If DOGE keeps its footing above the 200-week MA, the joint message of trend structure and momentum could set the tone for the next move across the wider digital asset market.
 Eseandre Mordi


