Saad Ullah
⬤ Dogecoin maintains its multi-year technical framework as DOGE moves within a broad ascending channel that's been shaping its price behavior for years. The weekly chart shows the asset sitting above key support near the channel's midline around $0.20, an area that's historically triggered trend continuations.
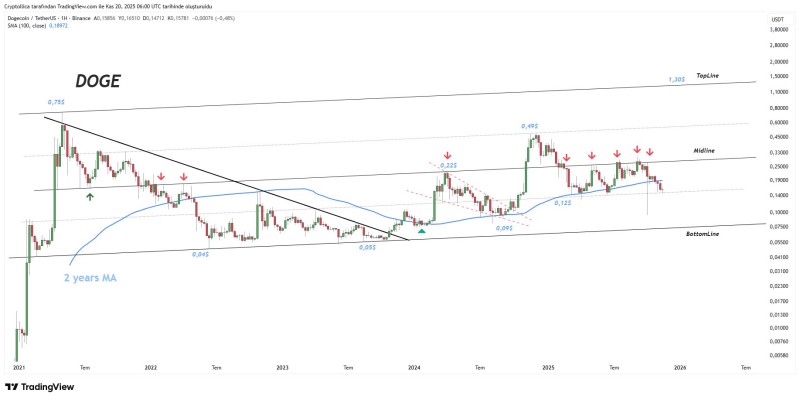
⬤ The chart reveals several reaction zones throughout the cycle. DOGE has bounced multiple times from the midline near $0.20 and deeper support levels at $0.045, $0.055, and $0.12. These historic points show a consistent buying pattern along the channel's lower edge. Earlier rallies toward the top section pushed prices to around $0.75. Right now, the weekly candle sits inside the trend after pulling back from mid-channel resistance near $0.33.
⬤ The 2-year moving average keeps working as dynamic support for DOGE. The bigger upward path stays unbroken, with the coin printing higher lows across major market cycles. Looking at the long-term setup, the next major barrier sits near the midline, then toward the channel's upper boundary where the $1.30 target lines up with previous trend moves.
⬤ This pattern matters because it locks DOGE into a multi-year bullish structure that's guided its major price swings. Staying within this rising channel backs up broader stability and hints at potential cyclical upside ahead. If weekly support holds firm, Dogecoin's move toward the $1.30 target would show ongoing market rotation and long-term trend strength.
 Saad Ullah