 Marina Lyubimova
Dogecoin (DOGE) is painting a picture-perfect bullish setup that savvy traders are calling "déjà vu." The meme coin's RSI is flashing the same signals that triggered massive rallies in the past, and if history repeats itself, we could be looking at a rocket ship to $0.32. A viral trading post on X shows how DOGE's current behavior mirrors its August breakout almost identically.
DOGE Price Action: The RSI Sweet Spot Strategy
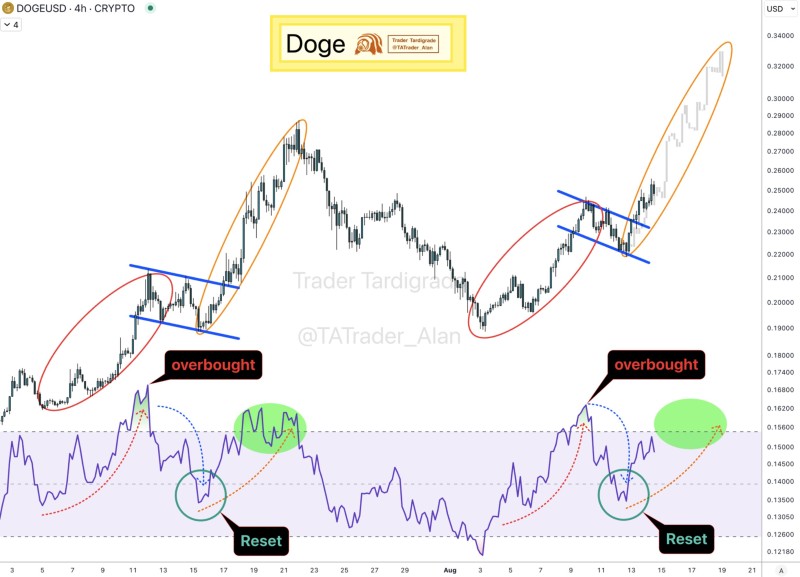
Right now, DOGE is sitting in what traders call the "Goldilocks zone" – just right for another explosive move. The 4-hour charts show DOGE climbing from $0.22 to above $0.26, with RSI doing exactly what it did before the last major pump.
We're seeing that classic "reset and reload" pattern where the momentum indicator takes a breather in overbought territory, then comes back swinging harder. When RSI stays elevated but doesn't crash, it usually means bulls are still in control – like a rubber band stretched and ready to release.
Historical Patterns Point to $0.30+ Breakout for DOGE Price
The chart analysis reveals DOGE loves to repeat its winning formulas. Back in August, this identical pattern played out beautifully, pushing DOGE into that coveted $0.30-$0.32 range.
What makes this compelling is how the RSI maintains strength while price consolidates, suggesting buying pressure is just taking a strategic pause. Key levels are crystal clear: current support around $0.26, with the next major target at $0.30-$0.32.
Of course, nothing in crypto is guaranteed, but the technical stars are aligning for another DOGE spectacular, and the RSI pattern is giving bulls plenty of reasons to stay optimistic.
 Marina Lyubimova


