 Usman Salis

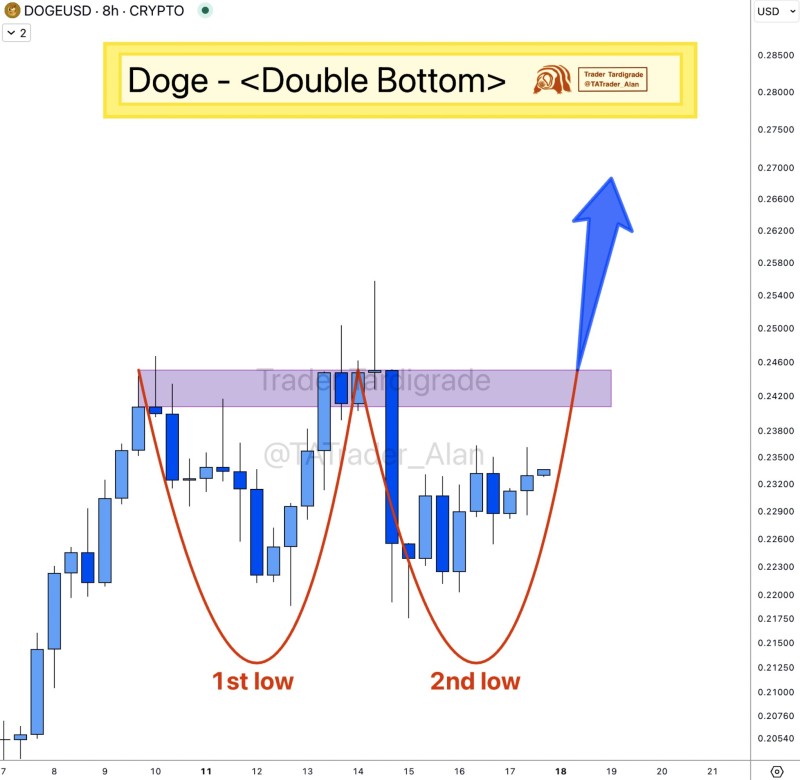
Dogecoin is doing something interesting right now that's got technical traders perking up. On the 8-hour chart, DOGE has carved out what looks like a textbook double bottom pattern – and if you know anything about chart patterns, you'll recognize this as one of the more reliable reversal signals in trading.
A sharp-eyed trader recently flagged this setup on Twitter, pointing out how the meme coin has basically tested the same low twice and bounced both times. It's like the market is saying "nope, we're not going lower" – and that kind of price action often precedes some decent upside moves.
DOGE Shows Classic Double Bottom Setup
Here's what's happening: DOGE hit a low around $0.218, bounced up, then came back down to test nearly the same level at $0.217. That second test is crucial because it shows sellers couldn't push the price any lower, even when they had a second chance.
This kind of pattern works because it reveals the market's true intentions. The first low might have been a fluke, but when price comes back to test that same area and holds again, it suggests there's genuine buying interest at those levels. Smart money often accumulates during these double-tap scenarios.
The key level everyone's watching now is $0.246 – that's the neckline of this double bottom formation. Think of it as DOGE's make-or-break moment. A clean break above this resistance would essentially confirm that the pattern is playing out as expected.
Breakout Could Target $0.27 Zone
If DOGE manages to punch through that $0.246 ceiling, the next logical target sits in the $0.26-$0.27 range. That might not sound like a massive move, but we're talking about roughly a 10% gain from current levels – not bad for a meme coin that's been sideways for a while.
What makes this target interesting is that it aligns with where the next major liquidity zone is expected to be. In simple terms, that's where a bunch of buy and sell orders are likely sitting, waiting to be triggered. When price hits these zones, it often creates the fuel for the next leg of the move.
The beauty of this setup is its simplicity. You've got clear support levels, a defined resistance to watch, and a reasonable target if things go according to plan. It's the kind of straightforward technical play that tends to work more often than complex, over-analyzed setups.
Dogecoin Ready to Make Its Move
Right now, Dogecoin is basically coiled up like a spring. The double bottom pattern has done its job of establishing a floor, and now all eyes are on whether buyers can step up and push through that $0.246 resistance.
If they can, we're likely looking at a move toward $0.27 – a solid 10% gain that would validate this bullish technical setup. If they can't, well, at least we know where the support levels are for the next buying opportunity.
Either way, DOGE is giving traders a clear roadmap of what to watch. Sometimes the best setups are the most obvious ones, and this double bottom is about as textbook as they come.
 Usman Salis


