 Saad Ullah

Dogecoin has demonstrated once again how recurring price behavior creates openings for traders who stick to their strategy. Following a quick bounce off resistance, the coin fell more than 6% in a single day—a reminder that simple, time-tested methods still work.
Recent Price Movement
Trader DD recently shared a chart from @tolkunflex on Twitter, showing how a basic trading setup has delivered consistent results over the years. The latest DOGE/USDT action on Binance tells a familiar story.
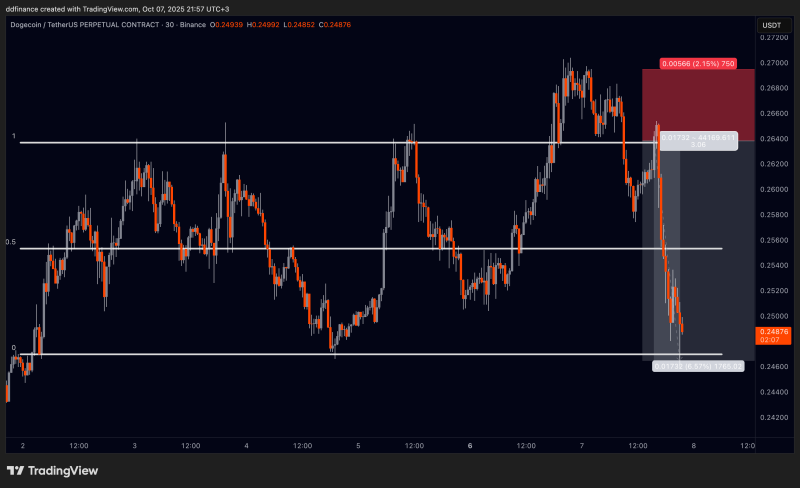
The coin tried pushing through the $0.268–0.270 area but couldn't hold above it. That rejection sparked a fast drop of 6.57%, bringing price down to around $0.248. This level has acted as a floor multiple times before, and right now DOGE is sitting just above it. The whole move stayed inside a well-known range between horizontal support and resistance lines, giving traders a clear framework to work with.
Why These Patterns Keep Working
There are good reasons why Dogecoin's technical levels tend to be more dependable than those of many other coins. Heavy trading volume and active retail participation mean the same patterns repeat themselves. The community around DOGE is strong and emotionally invested, which makes people respond to familiar price zones in predictable ways. Without major news driving the market, DOGE often trades sideways in these structured ranges until something big enough comes along to break the pattern.
 Saad Ullah


