 Usman Salis

Dogecoin has grabbed traders' attention with a technical signal that's historically led to strong rallies.
Key Technical Signals
Analyst Trader Tardigrade noticed DOGE's weekly chart looks similar to earlier cycles, where a long lower wick marked the bottom before prices shot up. Elliott Wave analysis suggests the coin might be gearing up for its next move, potentially signaling a powerful rally ahead.
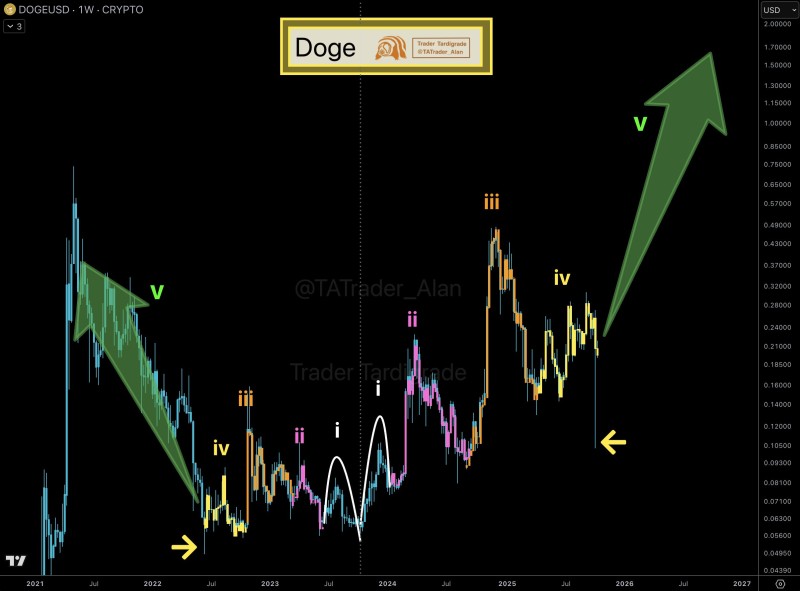
- Long Lower Wick: The latest weekly candle shows a long downward wick, meaning sellers pushed the price down but buyers quickly stepped in. This usually indicates selling pressure is running out.
- Support Zone: DOGE held the $0.10–$0.12 area, confirming it as solid support. Past cycles show strong bounces after defending similar levels.
- Resistance Targets: If momentum picks up, first resistance sits around $0.25–$0.28, with a breakout potentially pushing toward $0.50 and beyond.
- Wave Structure: Elliott Wave analysis suggests DOGE is in wave iv, preparing for a potential wave v rally that could target $1.00+ in a bullish scenario.
Why DOGE Could Rally
Dogecoin has a history of repeating boom-and-bust cycles, with consolidation periods ending in sharp rallies. Speculative interest in altcoins is returning as Bitcoin stabilizes, creating a supportive environment. The meme coin continues to attract retail attention and remains widely recognized. Additionally, improving macro conditions or increased market liquidity could give risk assets like DOGE an extra push.
The long wick on Dogecoin's weekly chart suggests sellers may be losing momentum at current levels. Combined with Elliott Wave patterns pointing toward wave v, conditions appear favorable for a new rally. The $0.10–$0.12 support zone is critical—if it holds, DOGE could initially target $0.25, with potential for $1.00 and beyond in a stronger cycle.
 Usman Salis


