 Peter Smith

Dogecoin just hit a technical sweet spot that has traders doing double-takes. The DOGE/BTC chart is painting a picture that looks almost identical to what we saw before the legendary 2021 pump.
The pattern is textbook: long consolidation, volume starting to creep up, and all the right ingredients for what could be another historic breakout. But here's the thing about cycles - they rhyme, but they don't always repeat exactly.
DOGE Chart Mirrors Previous Cycle Patterns
Analysis from Cryptoinsightuk shows Dogecoin trading at 0.00000226 BTC, sitting right on multi-year support that held firm during the last major accumulation phase.
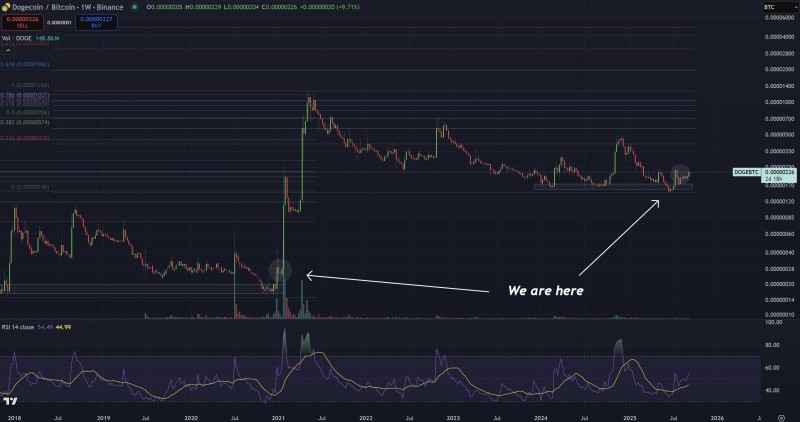
The weekly chart tells a compelling story. We're seeing the same type of base-building that happened in 2020, with price holding above crucial support around 0.00000170 BTC. Trading volume is picking up after months of sleepy action, and momentum indicators are finally showing signs of life. The RSI is climbing back toward bullish territory, suggesting buying pressure is building underneath.
What makes this setup interesting is the Fibonacci extensions pointing toward potential targets between 0.000005 and 0.000012 BTC if momentum really takes off. That's serious upside from current levels, though getting there would require the same type of manic buying we saw during the meme coin craze.
Why This Time Could Be Different (But Similar)
Bitcoin's recent stability creates the perfect backdrop for alt coins to shine, and Dogecoin has always been the poster child for speculative excess. The coin still has one of the strongest communities in crypto, backed by millions of retail investors who never really left the party.
Add improving market liquidity and the eternal appeal of meme coins, and you've got conditions that could easily spark another DOGE rally. The key difference this time might be that institutional money is more comfortable with crypto volatility, potentially amplifying any move that gets started.
 Peter Smith


