 Usman Salis

⬤ Cardano has been extending its decline and is now approaching a critical support zone around 0.30. Currently trading at 0.4959 on the 12-hour chart with a modest 2.40% intraday gain, ADA remains trapped below several key resistance levels that previously provided support earlier this year. The path lower looks increasingly likely as the token struggles to regain momentum.
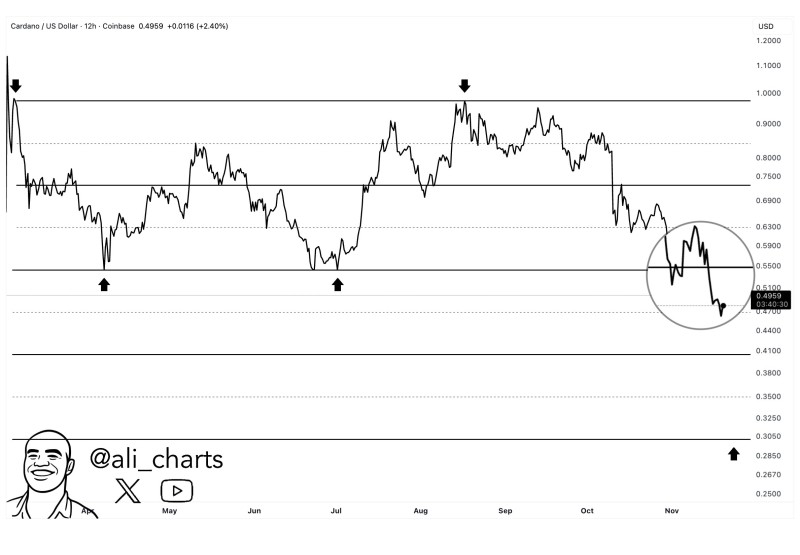
⬤ The chart reveals a series of long-term horizontal zones where Cardano has consistently reacted in the past. After forming lower highs and showing persistent weakness, ADA broke below the 0.55 level, which now serves as a major resistance barrier. With the price hovering around 0.50, the next substantial support sits significantly lower at 0.30—a level that acted as a strong reaction zone earlier in the year and could generate renewed buying interest if reached.
⬤ Historical price action shows ADA bouncing strongly from the 0.30 zone, suggesting it's been a meaningful demand area before. The recent pattern of lower highs and sustained downward pressure has pushed ADA away from mid-range levels near 0.69 and toward these deeper support zones. The chart structure shows a clear downtrend with few intermediate levels between the current price and the 0.30 target, meaning the descent could be swift.
⬤ This matters because Cardano has returned to a long-term support area that's historically influenced market direction. When price breaks through multi-month levels, it often reshapes trader sentiment, and the lack of significant support zones in between can amplify price swings. How ADA reacts around 0.30 could define the next chapter of its price story and determine whether the bleeding stops or continues deeper.
 Usman Salis


