Saad Ullah

Cardano has flashed a notable technical signal on the weekly chart, drawing attention from traders watching for signs of trend exhaustion after months of selling pressure. Analyst Ali Charts flagged the setup, noting that the TD Sequential indicator has completed a "black 9" - a pattern that historically marks the late stages of a directional move rather than a continuation.
What the TD Sequential Signal Means for ADA
The signal appeared against a backdrop of gradual stabilization, with ADA consolidating in the $0.25 to $0.27 range over recent weeks.
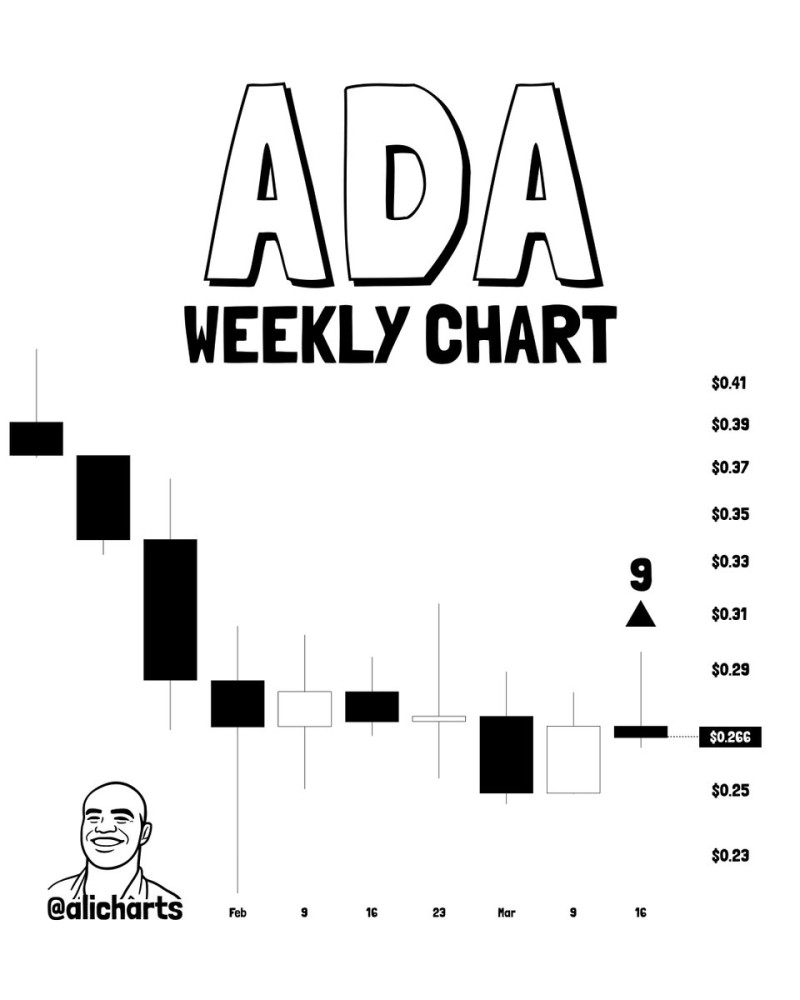
This is not a reversal trigger by itself - it signals that sellers may be losing steam.
The TD Sequential black 9 doesn't guarantee a reversal - it tells you the trend is getting tired. The level that matters now is $0.23.
As Cardano Flashes Bullish Divergence at $0.46 as Buy Signal Emerges previously documented, similar completions have preceded short-term upward moves lasting one to four weeks when key support held.
$0.23 Is the Level That Decides Everything
The critical threshold is a weekly close above $0.23. If that holds, the next upside targets are $0.32 and $0.37 - both previous price reaction zones visible on the chart. This mirrors the dynamic described in ADA Price Prediction: Buy Signal Triggers 2% Surge - Here's the Next Target, where a comparable signal preceded a short-term surge after a sustained decline.
A failure to hold $0.23, however, would invalidate the setup entirely and point toward further downside. As covered in Cardano Holds $0.37 Support as TD Buy Signal Emerges on Weekly Chart, TD Sequential setups require price stabilization to convert into sustained moves - the signal alone is not enough.
For now, the weekly structure suggests momentum conditions are shifting after a prolonged bearish phase. Whether ADA builds on this or continues lower will come down to price behavior at current support levels in the sessions ahead.
 Saad Ullah