Saad Ullah

Cardano (ADA) is drawing attention from investors hunting for signs of another significant rally. After last year's strong November push brought ADA closer to important resistance zones, market participants are wondering if we might see a similar pattern unfold in 2025.
ADA Price Setup and Key Chart Levels
The weekly ADA/USD chart reveals a decisive retest of the $0.64 mark following a sharp decline, according to trader Sssebi's analysis. There's a crucial support area sitting just above $0.50, while the longer-term structure hints at a possible rounded bottom formation taking shape.
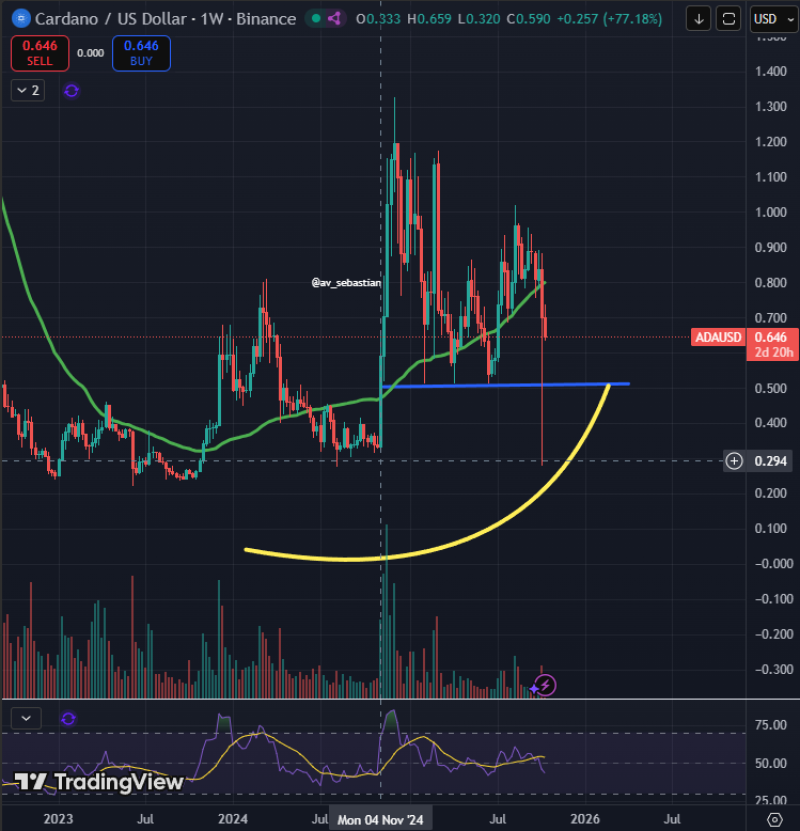
An upward curve visible on the chart suggests price consolidation might be setting the stage for a bullish turn. Breaking cleanly above the 200-day moving average and the $0.80 resistance would mark the first real confirmation that bulls are back in control.
Momentum and Market Context
The RSI indicator recently showed ADA dipping into oversold territory earlier this quarter before momentum started picking back up. Past ADA rallies have typically been driven by fresh retail enthusiasm combined with a general risk-on mood across crypto markets. Cardano's growing ecosystem - particularly around DeFi activity and staking participation - provides some underlying fundamental strength. If Bitcoin maintains its upward trajectory through 2025, altcoins like ADA tend to follow with even sharper percentage moves.
Could ADA Reach a New All-Time High?
Though ADA still trades well below its previous peak near $3.10, the chart structure leaves room for recovery if the right catalysts line up. Pushing through $0.80 would clear the path toward $1.20, and from there, retesting former highs becomes a realistic possibility. That said, downside risk is still present - losing the $0.50 support zone could send ADA tumbling closer to $0.30. Traders should keep an eye on volume surges and broader macro factors like U.S. interest rate decisions and overall crypto market liquidity.
 Saad Ullah