 Marina Lyubimova
While the crypto market trades sideways, a sharp-eyed trader spotted something interesting on Cardano (ADA) hourly chart - a technical signal that often marks the end of selling pressure.
What's Happening with Cardano (ADA)
Cardano trades at $0.9156, down 0.07% today in a tight range of $0.9074-$0.9171. After a series of red candles, the TD Sequential indicator flashed a "9" count - a signal that suggests trend exhaustion.
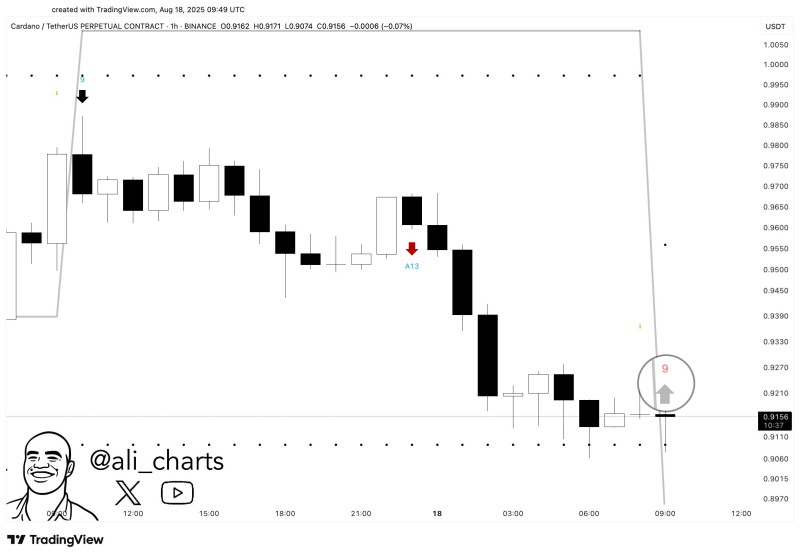
The TD Sequential works like a pressure gauge. When it hits 9, it's saying "this trend is getting tired." While not guaranteeing reversal, it's historically been solid at calling exhaustion points in major cryptocurrencies.
Why This Signal Matters
Most technical indicators are hit-or-miss, but TD Sequential has earned respect because it focuses on momentum shifts rather than just price. When it flashes a buy signal after extended selling, underlying pressure dynamics are often changing.
For ADA, this comes after gradual decline rather than aggressive selling - the kind of setup that often leads to bounces when technical conditions align.
What Traders Are Watching
The key question: will this signal translate into upward movement? Traders are watching $0.92 as the critical level. A clean break above would give the bounce thesis credibility, while failure could mean another false dawn.
What makes this setup intriguing is the lack of obvious resistance until that $0.92 zone. Sometimes the best moves happen when the path of least resistance suddenly becomes upward.
 Marina Lyubimova


