 Peter Smith
Cardano has been through the wringer lately, but it's not giving up without a fight. After repeated tests of the $0.50 support level, ADA keeps bouncing back—showing that buyers are willing to step in at this key price point. The 3-day chart is painting a picture of accumulation and potential reversal, giving traders a bit of hope that the worst may be behind us.
The Technical Setup
The analysis shared by Rand, the chart tells a straightforward story: $0.50 is the line in the sand. Here's what's happening:
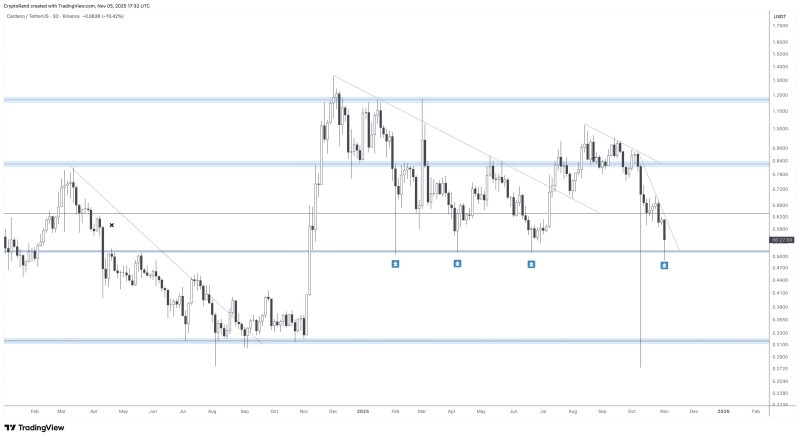
- Support defense: ADA has tested $0.50 multiple times over the past year, and each time it's rebounded toward $0.65–$0.70
- Descending trendline: A downward sloping resistance is creating a tightening wedge pattern
- Range-bound trading: Cardano is moving between $0.50 and $0.90, with clear accumulation happening at the lower end
- Reversal signals: The latest dip below $0.50 was quickly bought up, forming a long lower wick—a classic bullish rejection pattern
If ADA can break above that descending trendline while holding $0.50, we could see a move toward $0.70 in the coming weeks. The $0.65 level is the first hurdle, with stronger resistance around $0.85–$0.90.
The Bigger Picture
Cardano isn't alone—altcoins across the board are trying to find their footing after a tough stretch. While the broader crypto market has been dealing with lower liquidity and nervous sentiment, major layer-1 tokens like ADA are holding up at historically important support zones. That's usually a sign that long-term holders are accumulating quietly.
Oversold readings on the RSI and volume profile hint that the selling pressure might finally be running out of steam. For now, bulls are making a stand at $0.50—and if they can hold it, Cardano might just surprise everyone with a solid bounce.
 Peter Smith


