 Peter Smith

After getting hammered by several red candles in a row, Cardano might finally be catching a break. A tweezer bottom candlestick pattern has appeared at the bottom of the recent selloff—a setup that technical traders often associate with potential reversals.
What the Pattern Shows
According to Chris O Cardano DRep , the pattern is clean and textbook, with two consecutive candles sharing nearly identical lows. It's not a guarantee, but it's the first real hint that buyers might be ready to step back in.
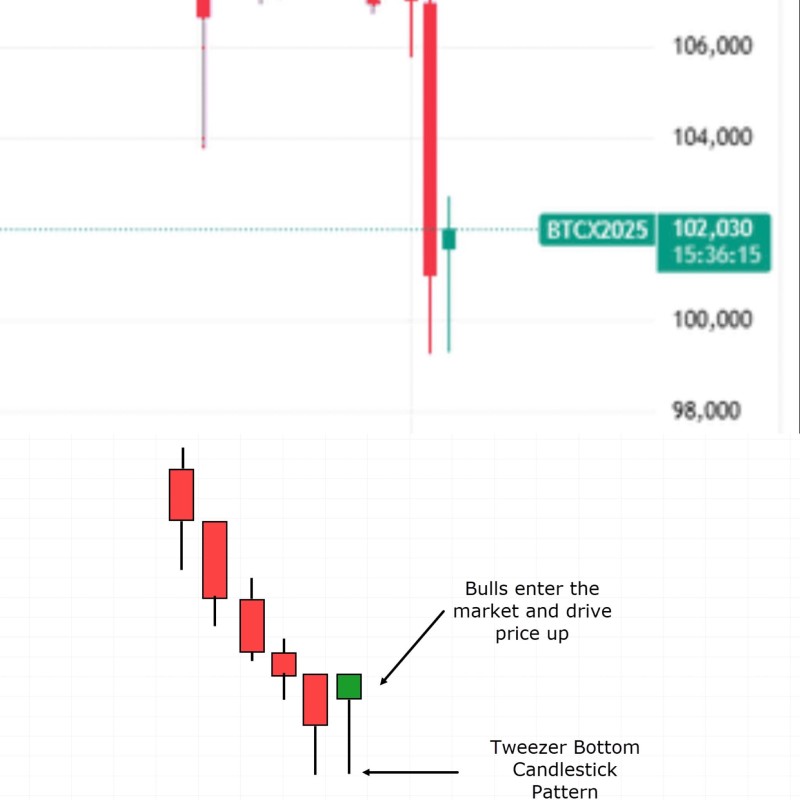
The tweezer bottom tells a simple story about shifting momentum:
- First candle: A long red candle captures the final wave of panic selling as bears push the price down
- Second candle: A green candle forms as bulls enter and defend the same support level, refusing to let the price fall further
When sellers can't break through on the second attempt, it often signals that the downside is running out of steam. For now, that's exactly what ADA's chart is suggesting.
Key Levels to Watch
Cardano recently tested the $0.52–$0.54 zone, a support area that's held up before. The tweezer bottom forming here adds weight to that level—it shows the market still sees it as a place worth buying. If bulls stay in control, ADA could push toward $0.62 next, with $0.70 in sight if momentum picks up. But if the price drops below $0.52, the pattern breaks and another leg down becomes likely.
This setup comes as the broader crypto market stabilizes after some choppy weeks. Bitcoin's bounce back above $100,000 has helped lift confidence across altcoins, giving traders reason to dip back into riskier plays like ADA. Still, this looks more like a technical bounce than anything driven by fundamentals—so most traders will want to see follow-through before calling it a real trend change.
 Peter Smith


