Usman Salis
Cardano (ADA) is setting up what could be one of its most promising technical patterns this year. After weeks of sideways movement, but there's a catch. ADA still needs to break through a stubborn descending trendline that's been in place since August, plus a horizontal resistance zone sitting between $0.74 and $0.77. If it clears both, we could see the start of a fresh uptrend.
Price Structure: Still Stuck Below Resistance
Analyst Lark Davis points out that ADA's daily MACD is close to forming a golden cross below the zero line—a bullish signal that last appeared in June and led to a 62% price surge.
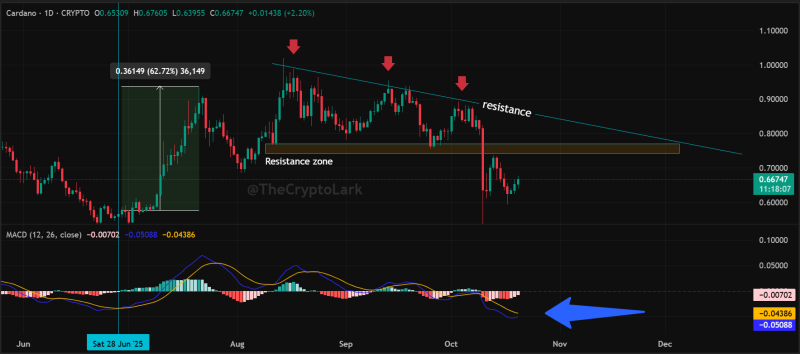
Right now, ADA is trading around $0.667, up about 2.2% on the day. That's a decent bounce, but the price is still trapped under that downward-sloping resistance line that's rejected every rally attempt since mid-August.
Here's what the chart shows:
- Current price: $0.667
- Key resistance zone: $0.74–$0.77
- Trendline resistance: Descending line connecting recent highs
- Support level: Around $0.63
The chart's red arrows mark where price got rejected multiple times at this descending resistance, proving it's a real barrier. A solid daily close above $0.77 would flip the script and confirm a trend reversal. Without that move higher, ADA might just keep grinding sideways below $0.70.
The MACD Signal: Why It's Getting Attention
The MACD indicator is showing early signs of a bullish crossover below zero. The blue MACD line is climbing toward the yellow signal line, which suggests selling pressure is fading.
This setup—often called a "golden cross below zero"—has historically been a reliable bullish reversal signal for ADA. The last time it happened was June 28, and ADA rallied 62.7% shortly after, jumping from around $0.36 to $0.58 in just a few weeks. That kind of historical precedent is why traders are watching this closely. If the crossover confirms over the next few days, it could be the spark that ignites ADA's next move higher.
For ADA to confirm its bullish momentum, it needs to clear two major technical roadblocks. First is the horizontal resistance zone between $0.74 and $0.77, which has turned back every upside attempt since September. Second is that descending trendline from August that's been capping rallies for three months straight. Breaking above both would signal the end of ADA's mid-term downtrend.
The MACD histogram is also starting to turn lighter red, another early hint that downward pressure is easing. If momentum keeps building, ADA could test that resistance zone before October wraps up. Meanwhile, Bitcoin's stability above key levels is helping altcoins like ADA regain some traction, and ongoing Cardano ecosystem upgrades—especially in DeFi and scaling—continue to fuel community optimism.
 Usman Salis