Marina Lyubimova

⬤ Bitcoin's long-term monthly chart is catching traders' attention as familiar cycle patterns emerge once again. The four-year cycle framework that's tracked Bitcoin's major moves since 2013 appears to be playing out right on schedule. The chart breaks down Bitcoin's price history into repeating phases—growth periods, bull market surges, and bear market pullbacks—with striking similarities across each cycle.
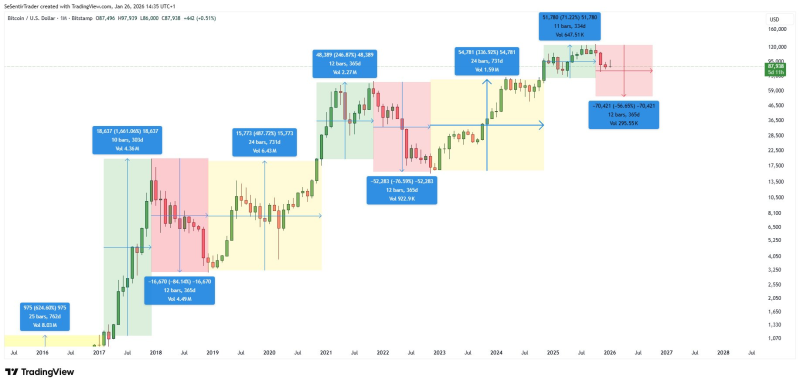
⬤ The framework shows a consistent structure: two years of steady growth, one year of explosive bull market action, and one year of bear market correction. These phases are color-coded in yellow, green, and red zones on the chart. The latest bull phase peaked in October 2025, matching the timing of previous cycle tops that kicked off extended downturns.
Each cycle consists of two years of solid growth, followed by one year of bull market acceleration, and one year of bear market correction.
⬤ Right now, Bitcoin sits in the bear market phase, which historically runs through October 2026. Past cycles show these bear phases often involve months of sideways trading before prices drop further. The chart demonstrates Bitcoin has repeatedly spent considerable time consolidating at higher levels before completing its bear phase journey.
⬤ This cycle perspective matters because it puts today's price swings into a bigger picture rather than reacting to daily noise. If the four-year pattern holds true like it has before, the market could face extended consolidation and corrections before the next growth phase kicks off. These cycles have lined up with Bitcoin's biggest turning points throughout its history, making them worth watching for anyone thinking long-term.
 Marina Lyubimova