Saad Ullah

⬤ Bitcoin is showing a textbook Class A regular bullish divergence. While price has made a new local low near the mid-$90,000 range, the oscillator underneath has formed a higher low. On the chart, the upper price structure slopes downward (marked in black and red), while the lower oscillator structure slopes upward (in blue and green). This mismatch suggests that bearish momentum is weakening even as price continues to drift lower.
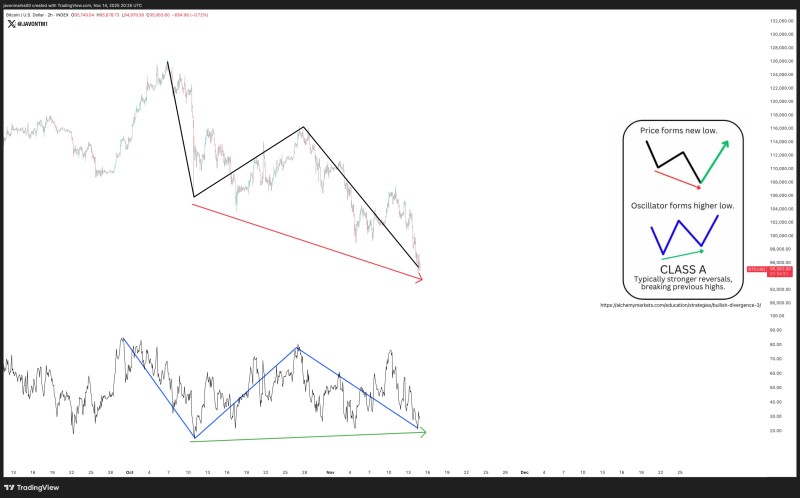
⬤ Class A divergence is considered the strongest type of bullish divergence and often precedes sharp reversals that eventually break prior highs once momentum confirms the turn. The graphic on the chart illustrates this: price creates a fresh low, but the oscillator prints a higher low—signaling that something is shifting beneath the surface before buyers step back in visibly. Bitcoin's current setup fits this description, with downside movement not matched by further weakness in the oscillator.
⬤ While Bitcoin keeps trending lower from recent peaks, the oscillator's higher low shows internal momentum is improving despite ongoing selling pressure. This is the hallmark of Class A divergence, which typically signals a sharp change in market direction and stronger reversals that break previous highs. The setup doesn't guarantee a reversal, but it does point to potential trend exhaustion.
⬤ This pattern matters because Bitcoin tends to lead the broader crypto market. If this bullish divergence confirms and BTC stabilizes, it could spark a momentum shift across major digital assets. With the divergence structure clearly in place, traders are watching closely to see if Bitcoin can turn internal strength into an actual price reversal in the sessions ahead.
 Saad Ullah