 Artem Voloskovets

⬤ Bitcoin recently broke down through an important Fibonacci retracement level—a move that's caught the attention of traders watching for signs of weakness. The chart shows BTC getting rejected near the upper Fibonacci bands before slipping below the curved trend line that's been supporting its broader rally since 2023. The breakdown is labeled as "Bearish Breakdown" on the chart, marking a shift in technical structure.
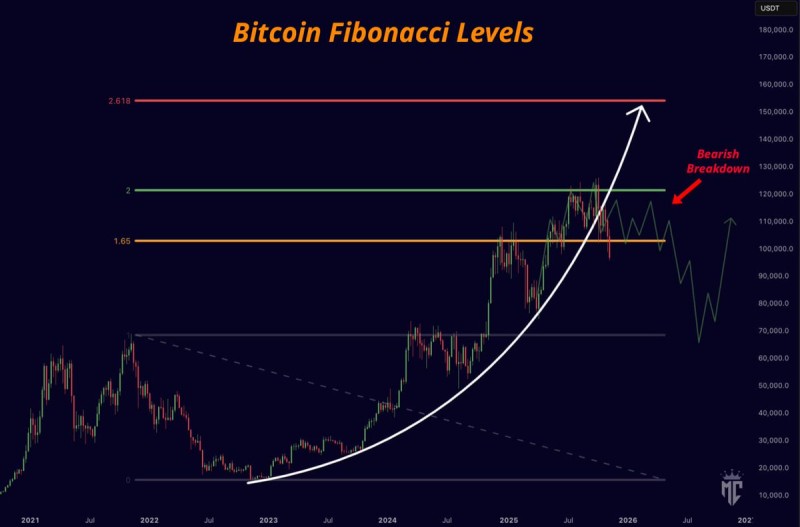
⬤ The drop below this Fibonacci zone suggests Bitcoin's bullish momentum may be fading. The chart outlines two potential scenarios: a corrective phase if the breakdown continues, or a recovery bounce if Bitcoin can reclaim the lost support level. These are technical possibilities based on the chart pattern, not firm predictions—just different paths the price could take from here.
⬤ For traders and investors, losing a Fibonacci support level matters because these zones often act as psychological anchors for trend continuation. When support breaks, it can shift market sentiment toward caution and increase short-term volatility. Right now, the focus is on how Bitcoin behaves around this level—whether it leads to deeper consolidation or if buyers step back in to push for a rebound.
 Artem Voloskovets


