Peter Smith

Bitcoin is entering a structured consolidation phase, with price action forming a clear range on higher time frames. The chart highlights a market transitioning away from impulsive swings into a controlled environment, where reactions at key levels - rather than constant movement - are shaping the next setup.
BTC Range: Support Near $62K, Resistance at $76K-$77K
BTC is trading between well-defined horizontal boundaries, with support near the lower range around $62,000 and resistance forming closer to the upper zone near $76,000-$77,000. The mid-range area around $69,000 acts as a pivot, where price has repeatedly reacted.
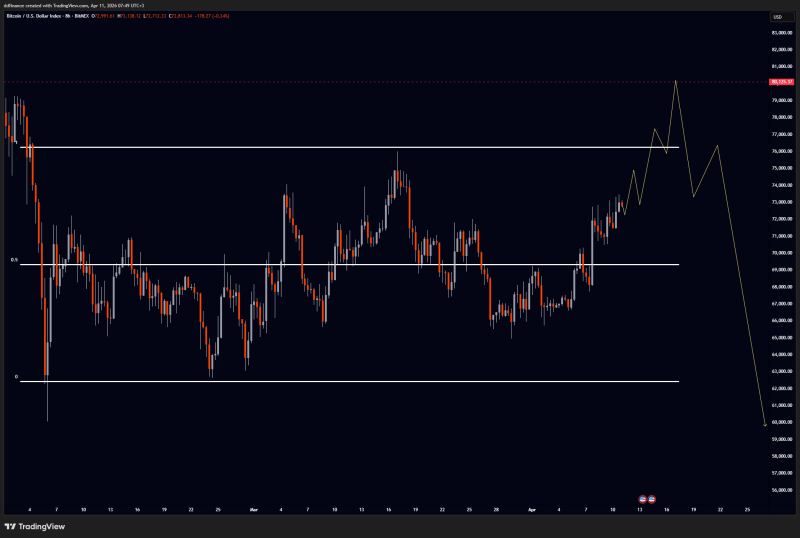
This structure reflects balance. Instead of trending, Bitcoin is rotating between these levels, establishing a framework where extremes matter more than the middle. As DD noted, a "nice range" is forming on larger time frames - suggesting that patience and positioning at key zones are more effective than chasing every move.
A nice range is forming on larger time frames - patience and positioning at key zones are more effective than chasing every move
The Red Zone Where BTC Rejection Becomes the Signal
The upper boundary, marked as a red zone on the chart, represents the primary resistance area. Price has not yet broken above this region, and it remains the key level defining whether the range continues.
The setup is specific: if BTC pushes into this resistance, fails, and then rotates back into the range, it reinforces the idea of a controlled structure.
If BTC pushes into resistance and fails, that rotation back into the range is the signal - not the breakout
This kind of rejection becomes the signal, not the breakout. A similar dynamic is explored in BTC Enters 9th Week of Sideways Movement as Range Compression Builds, where extended consolidation keeps price contained while pressure builds.
Why the Bitcoin Structure Still Favors Buyers
Despite resistance overhead, the structure is still considered bullish. Bitcoin is not breaking down below support, and recent price action shows stability rather than weakness.
The chart even suggests a potential push toward the $80,000 region if resistance is cleared, but that scenario remains conditional. Until then, the bullish bias is based on structure holding - not on confirmed expansion. Comparable setups, such as BTC Holds $65K-$72K Range as $72K Liquidity Zone Draws Attention and Bitcoin Range Builds Below $71K-$72K VaH Resistance, highlight how price can remain constructive even while capped by resistance.
The Behavior That Defines the BTC Setup
At this stage, the structure is driven by reactions, not direction:
- Rejection from the upper red resistance zone
- Re-entry into the range after testing highs
- Continued respect of support near the lower boundary
These elements determine whether the range persists or begins to resolve. Bitcoin is not breaking out - it is organizing. The range now defines the market, and as long as price holds within it, the bullish structure remains intact, even as resistance continues to cap upside.
 Peter Smith