 Saad Ullah

⬤ Bitcoin started the day with fresh strength, bouncing back from recent lows as the price climbed toward the $86,800 to $87,000 zone. Earlier gains have continued to flow throughout the session, with the chart showing a clean upward move following a sharp reversal candle. The price action points to improving sentiment after several sessions of downside volatility.
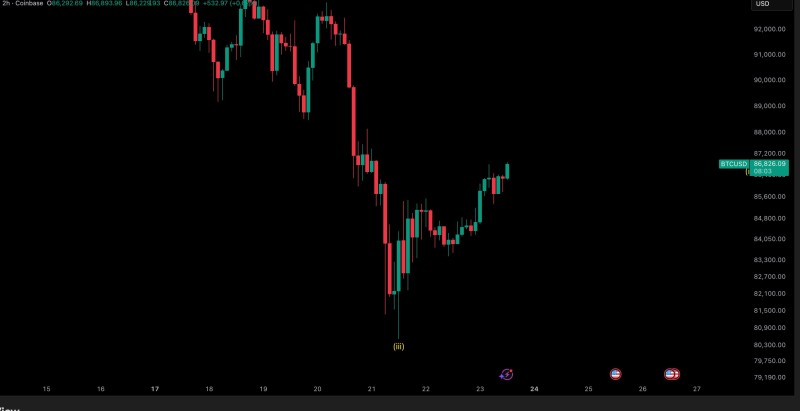
⬤ The chart shows BTC recovering from a steep drop that pushed the price down to the mid-$83,000 range before buyers jumped in aggressively. Since that bottom, Bitcoin has been forming a series of higher lows and higher highs—a structure that lines up with the intraday momentum shift visible on the 2-hour timeframe. The recent candle structure reflects growing confidence, and the current level near $86,800 puts Bitcoin back within the short-term recovery zone.
⬤ Profits from earlier positioning have already materialized, suggesting that the upward reaction was anticipated based on intraday behavior. While Bitcoin remains below the key $90,000 resistance region, the chart shows a solid recovery rhythm, especially after the deep wick that signaled exhaustion of selling pressure. Market participants will be watching whether the current bullish flow can extend toward the next technical resistance between $88,000 and $89,000.
⬤ This latest move in BTC matters because it shows how quickly sentiment can flip when liquidity returns. A sustained recovery could boost broader risk appetite across crypto, especially if Bitcoin holds these higher support levels in the coming sessions. With volatility still running hot, whether buyers can maintain this momentum may shape near-term market direction.
 Saad Ullah


