Saad Ullah

⬤ Bitcoin dominance appears to be losing steam after getting rejected twice at the 0.618 Fibonacci level. The monthly chart shows BTC dominance slipping to around 59% following repeated wicks near the 60.34% mark. These rejections have caught market attention and suggest a developing structure that might indicate further downside in the coming months.
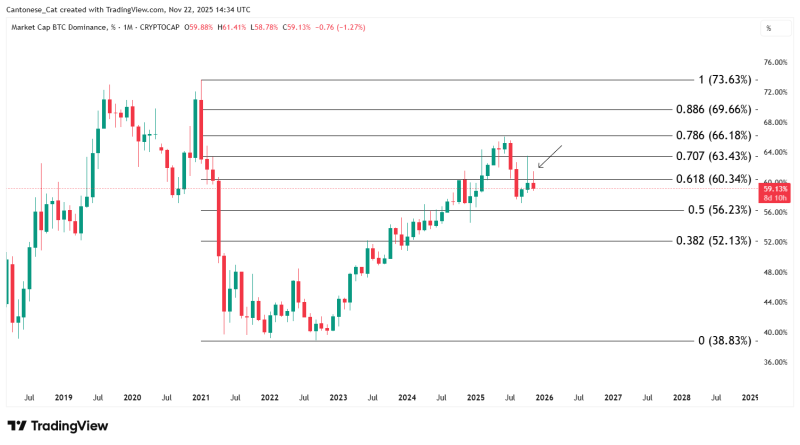
⬤ The chart displays a long-term Fibonacci retracement drawn from the major swing high near 73.63% down to the cycle low around 38.83%. After climbing steadily through 2023 and 2024, Bitcoin dominance reached the 0.618 zone twice but couldn't close above it. Recent candles show a pullback forming beneath the 0.707 and 0.618 levels, highlighting a clear loss of upward momentum. Those sharp rejection wicks at 0.618 reflect strong resistance and renewed selling pressure at this technical threshold.
⬤ The bigger picture shows a market structure that might be entering a cooling phase. BTC dominance slowed after a multi-year recovery and is now moving away from the upper Fibonacci bands. What makes this particularly interesting is that both Bitcoin dominance and BTC price declining together for months would be unprecedented. Historically, dominance rises when Bitcoin weakens or falls when Bitcoin strengthens. A simultaneous downturn would break these traditional patterns and point to shifting capital dynamics across the crypto market.
⬤ This matters because Bitcoin dominance directly affects liquidity flow and relative performance across digital assets. Extended weakness in dominance could signal growing altcoin strength, while combined weakness across BTC and its dominance would suggest broader market repositioning. How price reacts around the 0.618 Fibonacci level could shape market structure heading into 2026.
 Saad Ullah