 Eseandre Mordi

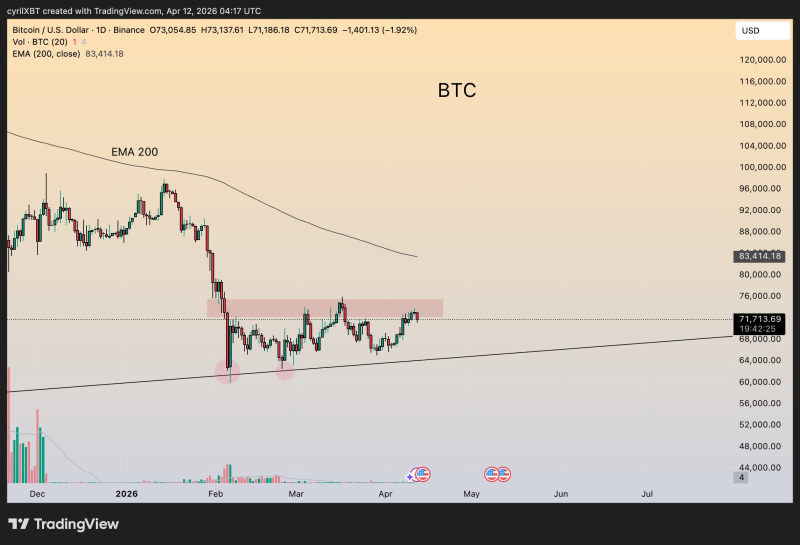
Bitcoin is sitting near $71,700 and pressing directly against long-term trendline support. As CyrilXBT noted, that ascending structure has been in place since the 2023 lows - making the current test especially important. The chart also shows BTC still trading below the 200-day EMA near $83,400, which is sloping lower, a sign that broader momentum remains under pressure.
The BTC Level Underneath the Entire Structure
The chart is defined by a consolidation range that has been in place since February, roughly between $68,000 and $76,000. Bitcoin is now sitting near the bottom of that zone, exactly where the macro trendline comes in. That overlap is what makes the current area so important - it is not just horizontal support, but a broader structural floor where two significant technical elements converge simultaneously.
So far, price has not broken cleanly in either direction. BTC is compressing at support while volume remains thin - and low-volume conditions tend to reflect hesitation rather than conviction, leaving the market vulnerable to a sharper move once participation returns.
BTC Pullback Tests Major Weekly Bitcoin Support Zone captured the structural importance of this support region on the weekly timeframe, showing how the same zone has been absorbing selling pressure across multiple test attempts.
Pressure From the BTC 200-Day EMA Still Dominates
The 200-day EMA remains well above current price at around $83,400, and its downward slope reinforces the idea that Bitcoin is still trading in a weaker technical position than earlier in the cycle. Rather than acting as support, that average is now overhead pressure.
This keeps the chart in a fragile balance. BTC is not in free fall - but it is also not showing the kind of strength that would suggest a clear recovery is already underway. Until price can reclaim higher levels inside the range, the broader structure remains defensive.
Why the BTC $68K-$76K Band Still Controls the Chart
The range itself is now the main reference point. If Bitcoin can hold the trendline and defend the lower edge of the $68,000-$76,000 band, the chart leaves room for a move back toward $76,000. If support breaks, attention shifts lower toward the next real support zone around $64,000-$65,000.
BTC Stalls Below $72K as Resistance Holds Firm shows what the upper end of this range has been doing - capping recovery attempts at $72K and reinforcing that the range is a genuine two-sided structure rather than a temporary pause before a breakout. BTC Tests $72K Resistance 3 Times as Range Breakout Pressure Builds reinforces how many times the upper boundary has rejected price, making the current test of the lower boundary the logical counterpart to those failed breakout attempts.
 Eseandre Mordi


