Usman Salis
⬤ Bitcoin's monthly candle is telling an unfinished story right now. The current price action suggests that neither the monthly high nor the monthly low will survive the rest of this period intact. Pointed out that we're seeing classic signs of incomplete development, with BTC trading between clearly defined monthly and yearly reference levels after pulling back from recent peaks.
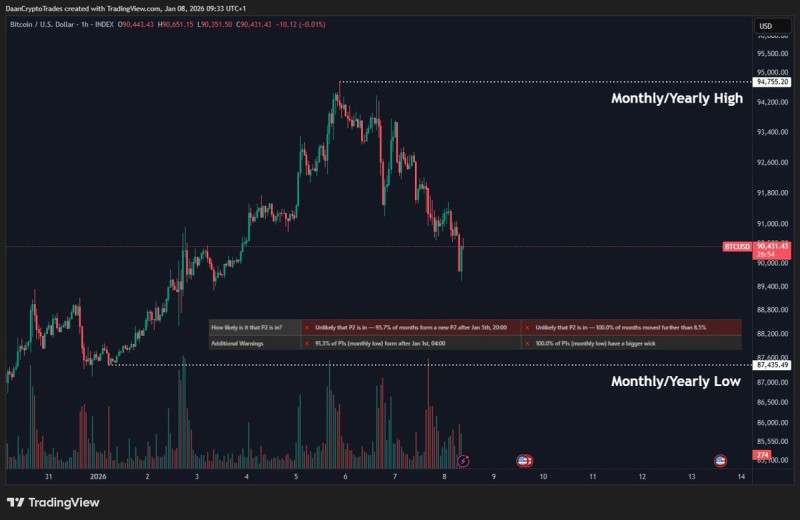
⬤ The historical pattern here is pretty compelling. Look back over the past two years, and you'll notice something consistent: every single monthly Bitcoin candle has printed a wick below the body that's larger than what we're seeing right now. That makes the current structure look statistically incomplete. The chart marks the monthly and yearly highs near the top boundary and the lows near the bottom, making it obvious that today's wick depth is relatively shallow compared to what usually happens.
⬤ Timing matters here too. Both the monthly high and low got established early in this candle's life, which historically bumps up the odds of seeing more movement in either direction before the month closes. Price is sitting between those two dotted reference zones on the chart, which suggests volatility isn't done with us yet as this candle keeps developing.
⬤ For traders watching the broader Bitcoin market, this setup is worth paying attention to. Incomplete monthly candles typically resolve by expanding their range before price settles down. A move toward the monthly or yearly low could help build a stronger base for later, but if that doesn't happen, downside risk stays on the table. With the yearly open fresh and a new monthly candle just getting started, these levels are going to be key reference points as Bitcoin figures out where it's headed next.
 Usman Salis