 Alex Dudov

⬤ Bitcoin (BTC) is back in the spotlight as a logarithmic chart reveals repeating cycles that have shaped every major bull run and correction over the years. The visual breakdown maps completed cycles and positions current price action inside a familiar declining channel—the same pattern that's kicked off serious upside moves before. Despite all the doom and gloom you hear online, the structure still leans bullish unless one critical level gets smashed.
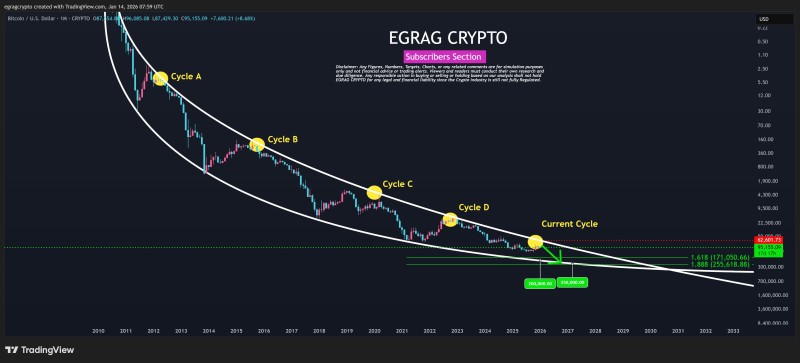
⬤ The chart tracks several past cycles labeled Cycle A through Cycle D, each one playing out inside a downward-sloping channel before exploding into monster expansion phases. Right now, Bitcoin's hanging near the lower edge of this long-term structure—historically, that's been the zone where downside momentum runs out of gas. The projection shows Fibonacci extension targets around the 1.618 and 1.888 levels, pointing to price zones above $170,000 and potentially toward $250,000 based on how previous cycles behaved.
⬤ But there's a line in the sand. A decisive monthly close below $70,000 wouldn't just be another dip—it would mean the entire cycle structure is busted. If that happens, the chart suggests Bitcoin could drop back to deep historical liquidity zones tied to old CME gaps. Still, the current framework puts more weight on the continuation scenario, showing this cycle matching up better with previous expansion phases than with a breakdown.
⬤ This matters because Bitcoin's cyclical moves usually dictate the vibe for the entire crypto market. The chart backs up what many traders already know: markets punish overconfidence on both sides while rewarding those who stick to structure. With BTC still respecting its long-term channel and historical pattern, the focus now is on patience and waiting for structural confirmation as we approach a major turning point.
 Alex Dudov


