 Eseandre Mordi

⬤ Bitcoin's been grinding sideways for days now, stuck between roughly $90,000 and $92,000. This drawn-out consolidation has let liquidity stack up on both sides of the market. The heatmap shows growing clusters of potential liquidation levels above and below the current range, hinting that this tight setup probably won't last much longer.
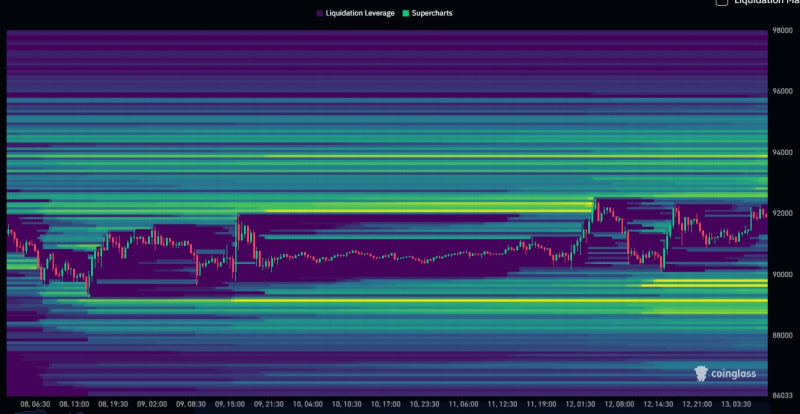
⬤ Looking at the chart, the biggest upside liquidity sits between $92,600 and $94,000. That's where stop orders and leveraged positions are likely bunched up. On the flip side, there's a chunky pocket of liquidity between $89,800 and $88,700—a significant zone below recent lows. These areas have become more defined as Bitcoin keeps chopping around without picking a direction.
⬤ The heatmap shows how several days of choppy action have built up liquidity in both directions. With Bitcoin locked in the same range for nearly five days straight, the odds of price hitting one of these highlighted zones keep climbing. These conditions usually come right before sharper moves as liquidity gets tested and traders reposition.
⬤ This matters for the broader market because when Bitcoin finally breaks out of its range, it tends to trigger volatility across the entire crypto space. With liquidity clearly stacked above and below current levels, everyone's watching to see whether price pushes toward the $92.6K–$94K zone or drops to the $89.8K–$88.7K area. As Bitcoin keeps coiling up in this tightening range, the next move should have a real impact on near-term market momentum.
 Eseandre Mordi


