Saad Ullah

⬤ Bitcoin is hanging around the $92,500 to $93,000 range as on-chain data reveals some critical price levels to watch. The MVRV Extreme Deviation Pricing Bands show resistance sitting at $99,000 and $122,000, while support zones are marked at $76,000 and $53,000. The chart reflects where Bitcoin stands within these statistical bands as of December 11, 2025.
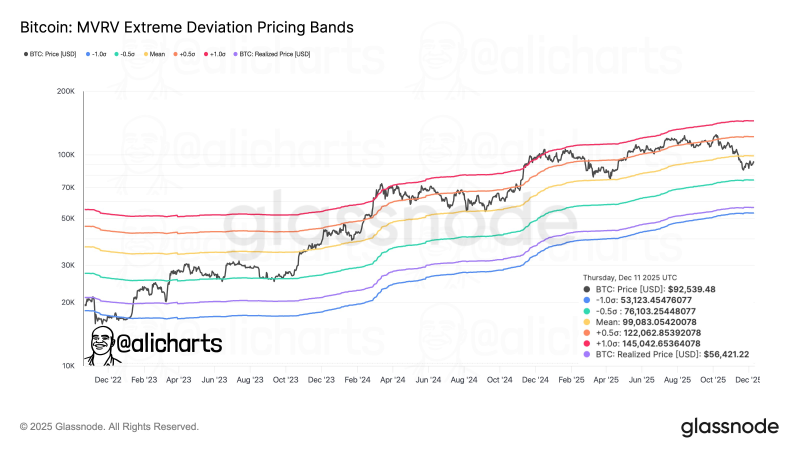
⬤ Right now, Bitcoin is trading at roughly $92,539, which puts it below the +0.5σ deviation band near $99,083 and far below the +1σ level around $145,000. The MVRV framework basically compares Bitcoin's current market price with its realized price—shown at about $56,400 on the chart. This tells us how BTC is trading compared to the average cost basis of all coins that have moved on-chain.
The MVRV bands provide context for where Bitcoin sits relative to long-term holder behavior and historical valuation extremes.
⬤ Looking at potential downside, the chart marks the −0.5σ band near $76,100 as the first major support level, with deeper support around the −1σ level close to $53,100. These zones have historically lined up with price stabilization during broader market corrections. Recent price action since late 2024 shows Bitcoin moving within these bands rather than pushing into extreme valuation territory.
⬤ What this means for the market is pretty straightforward—MVRV deviation bands help traders assess whether Bitcoin is overvalued or undervalued relative to on-chain fundamentals. With BTC sitting between key resistance and support zones, the model suggests we're operating within normal historical valuation ranges. As long as Bitcoin stays inside these bands, we're looking at consolidation rather than any statistically extreme price conditions.
 Saad Ullah