 Usman Salis

⬤ Bitcoin has been trading along an upward trend since mid-August 2025, and it's now testing a key support line on the chart. After dropping about 33% from its peak, BTC is attempting to recover. The last two trading sessions show efforts to maintain this rising trend, with prices holding above the $94,000 zone. This area is crucial for determining whether the momentum can stabilize.
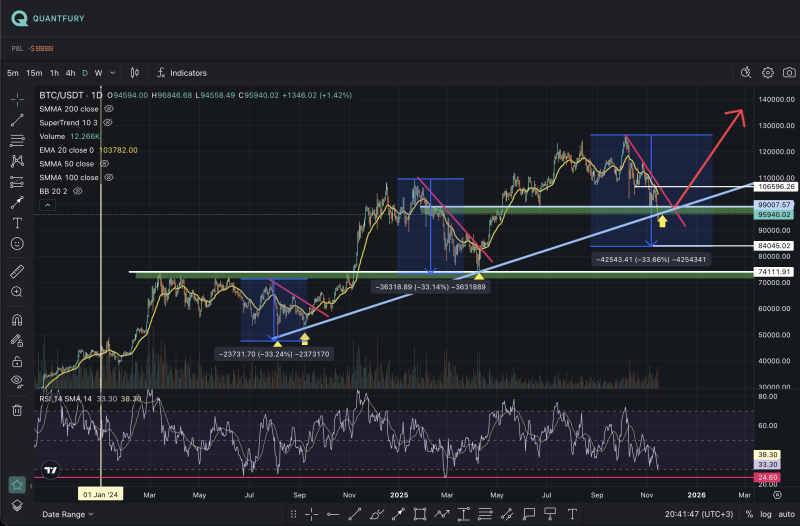
⬤ The chart shows a pattern of similar-sized pullbacks, each followed by fresh attempts to push higher. Strong support sits at $84,000 beneath the trendline, marking the lower edge of the current range. The next big hurdle is $99,000—Bitcoin needs to reclaim this level to rebuild upside momentum. Breaking above it would match previous recovery patterns and push BTC back into the upper part of its recent range.
⬤ If Bitcoin moves decisively above $99,000, the next target is $106,000. This level matches prior resistance and represents the top of the recent consolidation zone. Clearing $106,000 would put Bitcoin in position to set a new all-time high, as the chart's projected arrow shows this potential move if the rising trendline holds.
⬤ This setup matters because how price behaves around long-term trend support often shapes broader market sentiment. A solid rebound that breaks through these resistance levels could strengthen confidence in the bullish structure. However, dropping below the $84,000 support would signal a meaningful shift and could change expectations for Bitcoin's next phase.
 Usman Salis


