 Artem Voloskovets

⬤ Bitcoin's recent consolidation after hitting new highs mirrors past cycles that ended in sharp corrections. Historical data shows previous drawdowns ranging from 50% to over 80%, with price ultimately finding support around the 200-week exponential moving average—a level that's held significance across multiple cycles.
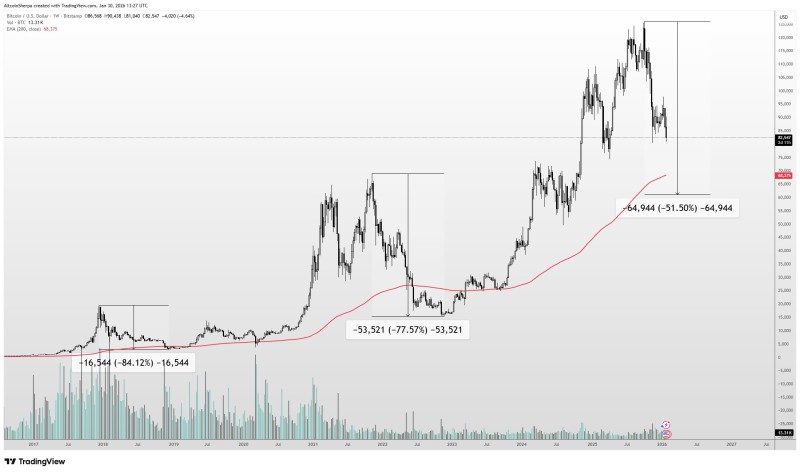
⬤ Looking at past corrections, Bitcoin saw drops of roughly 84%, 77%, and just over 50% from peak to trough. If the current cycle follows the lighter 50% correction pattern, we'd be looking at prices around $60,000. But here's the thing—the 200-week EMA has shifted upward to about $70,000, reflecting Bitcoin's long-term price growth and changing market structure.
⬤ What makes this different from earlier cycles? The introduction of Bitcoin ETFs in 2023 and broader institutional participation have fundamentally altered market behavior. Still, Bitcoin's holding above the zone that marked the May 2025 bottom, suggesting the floor hasn't fallen out yet—even if downside risk remains real.
⬤ Bitcoin typically leads the broader crypto market, so these technical levels carry weight beyond just BTC. The $70,000 mark and that 200-week EMA aren't just numbers—they're psychological and technical anchors that could trigger major moves if tested. A drop to $60,000 would fit historical patterns, but right now Bitcoin looks more like it's consolidating gains rather than rolling over into a full reversal. How price acts around these long-term supports will likely set the tone for what comes next.
 Artem Voloskovets


