 Usman Salis

⬤ Bitcoin has been forming higher highs and higher lows on the 4-hour chart following last week's drop. Price is currently consolidating within Monday's range between $89,100 and $85,200, sitting near the middle. After the sharp selloff, BTC moved into an ascending channel, leaving traders uncertain whether this signals real strength or just a corrective bounce.
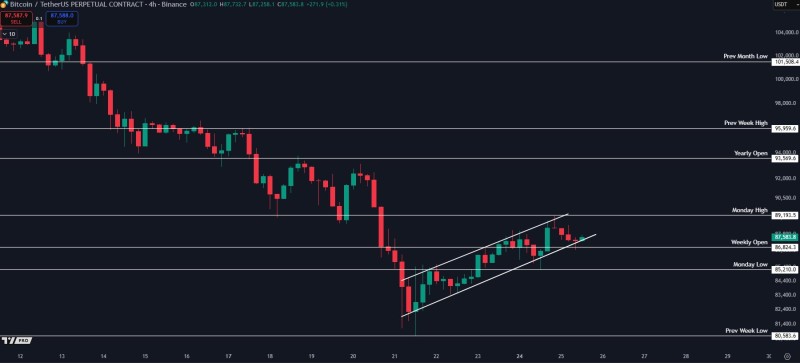
⬤ Despite the upward structure, the pattern could still be a bear flag in disguise. Bitcoin is trading around $87,500, with Monday's high at $89,100 serving as the main resistance. A clean break above this level would kill the bear flag setup and potentially push BTC toward $91,000–$93,000. The chart shows key resistance and support zones pulled from previous weekly, monthly, and yearly levels.
⬤ The lower edge of Monday's range at $85,200 is the critical support to watch. If BTC closes a 4-hour candle below this level, it would confirm renewed weakness and likely trigger a move toward the lower $80,000s. With volatility tightening inside the channel, a decisive breakout or breakdown appears imminent as Bitcoin tests both boundaries.
⬤ This setup is important because BTC sits at a technical crossroads where both continuation higher and deeper correction remain in play. How the market reacts to $89,100 and $85,200 will determine whether Bitcoin breaks into a higher range or revisits deeper support levels.
 Usman Salis


