Peter Smith

⬤ Bitcoin again draws notice after a technical signal that once marked three market bottoms reappears. The weekly chart shows the Relative Strength Index at the same low level recorded in March 2020 and the DSS indicator now turns bullish. The two signals together preceded sharp upward reversals in the past - traders again argue about a possible large bounce.
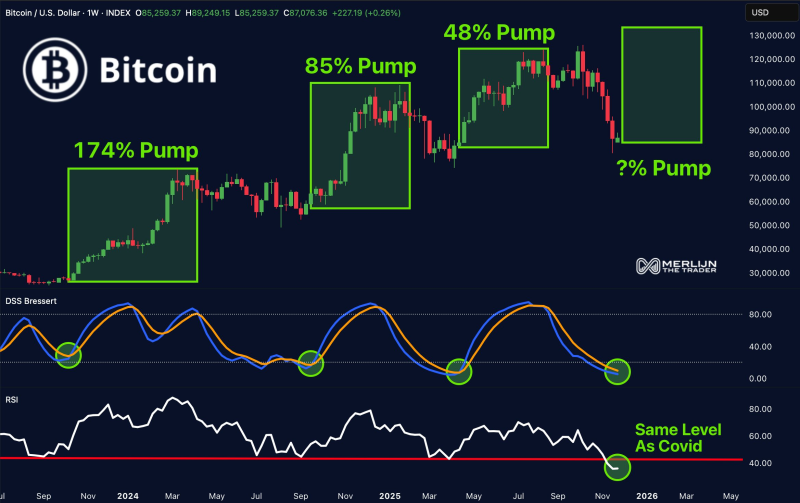
⬤ The pattern's history is clear. When RSI besides DSS aligned in late 2023, BTC rose 174 percent. The next setup produced an 85 percent climb, followed by a 48 percent gain in the most recent cycle. BTC now trades near the mid-80,000 dollar area, while the DSS momentum indicator turns up from oversold territory once more.
This repetition of signals points to market conditions similar to previous swing lows, where momentum shifts came before strong upward moves.
⬤ The signal stands out because the present RSI low equals the level reached during the COVID crash - a level many treat as the point where capitulation ends. Sentiment now shows similar exhaustion - traders watch for a sharp rebound. Past gains show that BTC tends to rebound forcefully after this pair of signals.
⬤ The shift in momentum matters because it often marks the switch from weakness to accumulation. When RSI falls deep into oversold ground and momentum indicators turn upward, participants usually return with fresh activity. The next few weeks will reveal whether BTC follows its historical pattern or departs from prior recoveries.
 Peter Smith