Peter Smith

⬤ Bitcoin continued its short-term correction, establishing another lower low as part of an ongoing five-wave decline. This suggests wave C may now be complete, though it's too early to confirm. The chart shows the full five-wave drop into the monitored support area, indicating BTC has reached its anticipated downside target.
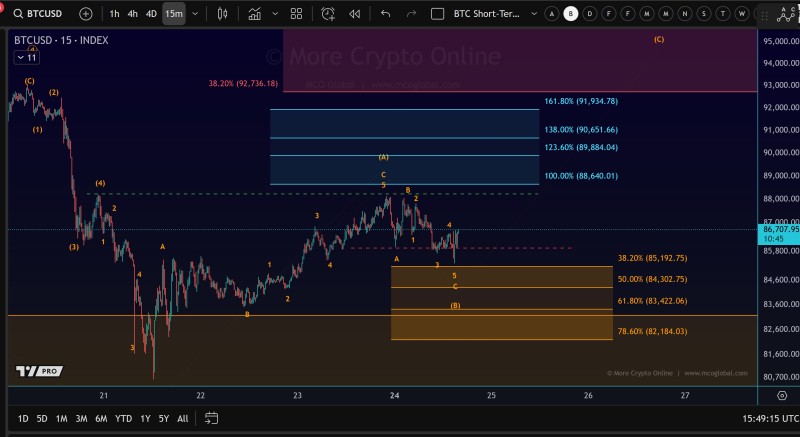
⬤ The analysis shows Bitcoin's decline unfolded in a clear Elliott Wave sequence, completing a structured five-wave move into the support zone between $82,100 and $85,100. This region aligns with Fibonacci retracement and extension levels, while earlier resistance near $88,600 and upper projections between $88,640 and $92,736 capped upward attempts. Despite fulfilling the expected downside pattern, the lack of confirmed reversal signals ongoing uncertainty.
⬤ Price action throughout the corrective leg has matched the mapped Elliott Wave structure, with the chart detailing each internal wave movement from previous highs. Short-term volatility remains elevated as Bitcoin tests this support cluster, and market behavior at these levels will determine whether stabilization follows or further correction unfolds.
⬤ This matters because reaching the potential completion of wave C could influence near-term direction and broader sentiment in the digital-asset space. Bitcoin's reaction around current support levels will signal whether the market is preparing for recovery or sustaining its corrective structure.
 Peter Smith