 Usman Salis
● Bitcoin's weekly SuperTrend indicator turned bearish, and that's raising eyebrows across the market. This technical tool has tracked major reversals with surprising accuracy since 2014. Every time it flipped negative—in 2014, 2018, 2019, 2021, and 2022—Bitcoin went through serious corrections. We're talking drops between 38% and 75%. Right now BTC sits around $95,513, and the chart pattern looks eerily similar to those previous cycles.
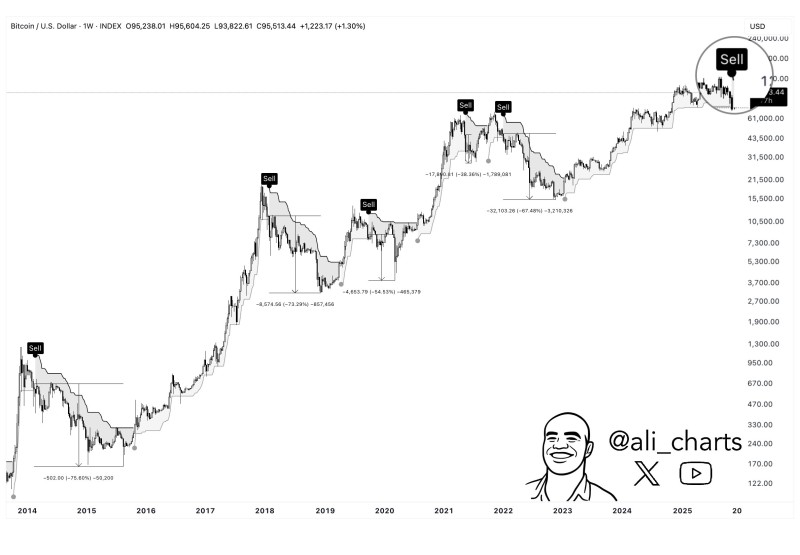
● The historical track record tells a consistent story. When the indicator flashed red in 2014, Bitcoin crashed 75%. The 2018 signal came right before a 73% plunge. Then 2019 saw a 54% pullback, followed by 48% in 2021 and 67% in 2022. Each time, the SuperTrend caught the top before things went south. The current setup near $95,000 shows the same warning pattern forming after months of steady gains.
● Looking at the bigger picture, Bitcoin typically moves from strong rallies into extended corrections once this indicator shifts. The grey bands on the chart tighten up before downturns hit, and price action follows through with steep declines. What we're seeing now mirrors those earlier peaks—a rounded top forming around the 2024 high with price starting to slip. The placement of the latest sell signal lines up with the multi-year topping structures we've seen before.
● This bearish reading matters because it's throwing up a red flag right as Bitcoin trades near cycle highs. The pattern has repeated itself for over a decade, and that kind of consistency tends to shape how traders think about what comes next. Whether Bitcoin follows through with another major correction or breaks the pattern this time will be crucial for anyone watching the market's next big move.
 Usman Salis


