 Peter Smith

⬤ Bitcoin pulled off a sharp intraday recovery after getting knocked down, bouncing hard off the $85,000 support area. The bounce lifted BTC back above the $86,115 volume control point and pushed it over short-term moving averages. The price action formed a classic V-shaped recovery pattern—usually a sign of shorts getting squeezed and tactical buyers jumping in rather than any major trend change.
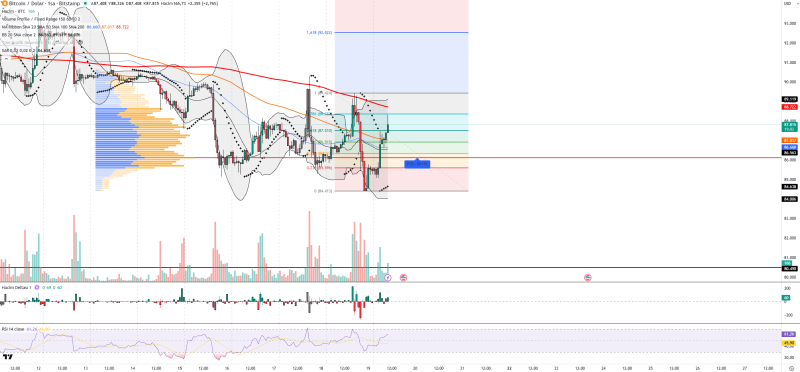
⬤ The technical picture backs up the short-term recovery story. The RSI climbed to around 61, showing strengthening momentum without getting overheated. Volume picked up during the rebound, confirming real buyer interest, while volume delta flipped positive—meaning demand was clearly running the show during the move up. Bollinger Bands show price heading back toward the middle band, and Parabolic SAR dots have dropped below price, both pointing to continued short-term upward pressure.
⬤ But here's the catch—the bigger picture still shows resistance overhead. The 200-period moving average and a downward trendline are sitting above current price, acting as ceiling and limiting how far this bounce can run. Key resistance zones are around $87,500, $88,700, and $90,000. On the flip side, support levels sit near $86,100, $85,600, and $84,600—areas that previously caught selling during the drop. This setup suggests we're looking at a relief rally inside a larger correction, not a full-blown reversal.
⬤ Looking at the broader market, Bitcoin's rebound seems mostly driven by technical factors and traders adjusting positions. The lack of fresh bad news from the ETF space helped steady things, while wider risk sentiment still hinges on US interest rate expectations and equity market moves, especially what Nasdaq does. Until BTC can hold above those major resistance zones consistently, price action will likely stay choppy and reactive to macro headlines and liquidity shifts.
 Peter Smith


