 Usman Salis

⬤ Binance Coin's price movement shows the corrective phase probably hit its temporary high, with wave (B) topping out in the expected resistance area. This played out just as the chart structure suggested – the upside was always going to be limited near this zone. The 4-hour chart shows BNB stalling after trying to bounce back, unable to hold ground above important retracement levels.
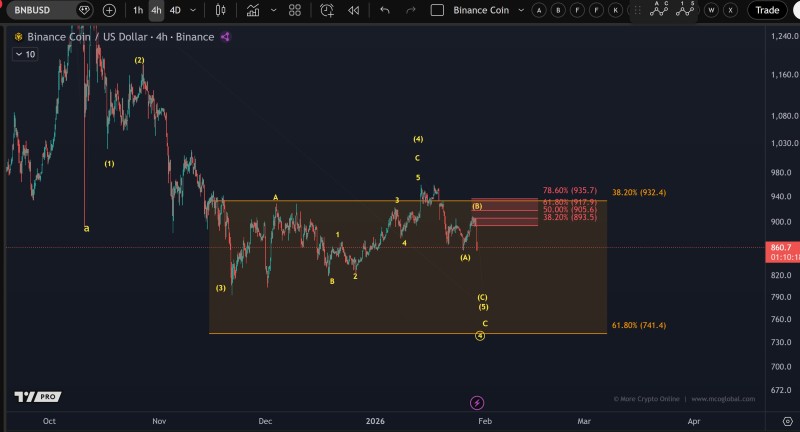
⬤ Fibonacci resistance is stacked between the 38.2% and 78.6% retracement levels, covering roughly the mid-$890s to mid-$930s range. When price got rejected in this zone, it backed up the idea that wave (B) wrapped up its part in the corrective sequence. After this rejection, BNB turned down, showing the retracement phase was over rather than continuing the previous upward push.
⬤ Looking at the bigger picture, Binance Coin is still stuck in consolidation after dropping from above the $1,000 mark earlier. The shaded area on the chart shows repeated reactions inside this zone, pointing to an ongoing tug-of-war between buyers and sellers. "The inability to reclaim resistance suggests that bullish momentum remains constrained," highlighting that we're in a corrective market rather than seeing a strong upward move.
⬤ This technical setup matters because it pins down where Binance Coin sits in its broader market structure. Spotting a completed wave (B) helps frame what to expect for near-term price action and volatility. As long as BNB stays below the highlighted resistance zone, the pattern suggests downside continuation is still in play, keeping focus on how the next phase of this correction develops.
 Usman Salis


