 Usman Salis

⬤ Bitcoin is currently trading near one of its most watched technical levels—the weekly 100-day moving average. This indicator has proven to be a significant support zone throughout multiple market cycles, and its current test has traders paying close attention. Past data shows that whenever Bitcoin approached this moving average, the market experienced notable price swings that shaped the direction for months ahead.
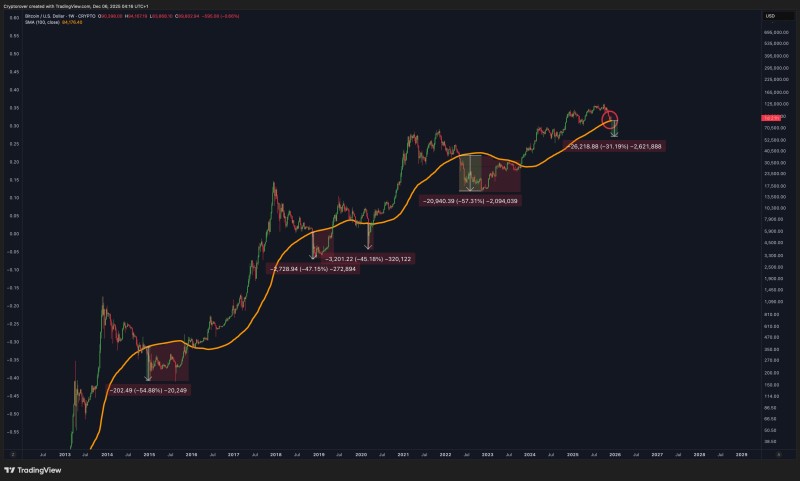
⬤ Looking back at previous cycles, Bitcoin saw dramatic pullbacks when it lost this key level, with declines reaching 45% and 57% during different periods. Right now, the setup looks familiar—BTC is hovering close to this moving average after several months of upward movement. Historical patterns show that breaking below this trend line has consistently led to extended correction phases, which makes the current moment especially critical for determining what comes next.
⬤ The weekly 100MA has repeatedly served as a bull market foundation, providing clear directional signals during major turning points. Data from 2015, 2018, 2020, and 2022 shows multiple instances where holding this level coincided with trend continuation. Bitcoin's latest approach to this moving average suggests the market is reaching a technically important crossroads, with traders focused on whether the price can stabilize or will drop below this zone.
⬤ Whether Bitcoin holds this level matters because it influences confidence across the entire crypto market. Successfully defending this support could strengthen bullish momentum and keep the cycle intact, while a breakdown might shift sentiment and increase the risk of further declines. How Bitcoin behaves around this threshold will likely shape market expectations and trading strategies across the sector in the weeks ahead.
 Usman Salis


