 Marina Lyubimova

Bitcoin is at a crossroads. After a rough couple of days, the price slipped below a key support zone, and now traders are watching one level above all others: $102,100.
What the Chart Is Telling Us
According to Crypto Tony, this is where the battle lines are drawn. Bulls need to take it back fast—or risk watching BTC slide even further.
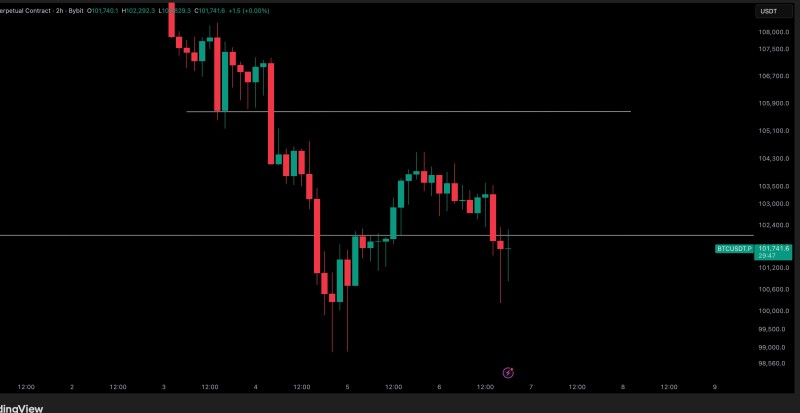
Bitcoin's 2-hour chart paints a pretty clear picture of what's happening:
- Breakdown confirmed: BTC lost $102,100 decisively, tried to retest it, got rejected hard, and kept falling—textbook support-to-resistance flip
- Lower high locked in: After the initial drop, Bitcoin rallied toward $103,000 but couldn't break through, forming a lower high that signals continuation to the downside
- Compression building: Smaller candle bodies, longer wicks, and choppy price action suggest a bigger move is coming—either up or down
- Key levels to watch: Resistance sits at $102,100 (must reclaim) and $102,800; support is around $101,200, with $100,600 as the next major downside target
Why Bitcoin Is Under Pressure
A few things are weighing on BTC right now. Macro uncertainty—especially around Treasury yields and rate expectations—is making risk assets nervous. Spot Bitcoin ETF inflows have slowed down, taking some steam out of the rally. The U.S. dollar is strengthening, which historically isn't great for Bitcoin. And with the weekend approaching, liquidity is drying up, which tends to amplify volatility.
If Bitcoin can't reclaim $102,100, sellers stay in control and we're likely heading toward $101,000 or even $100,600. But if bulls manage to push back above $102,100 and hold it, that would flip the script—opening the door to $103,000–$103,500 and restoring some short-term confidence. Long-term, the trend is still bullish, but the short-term structure needs to shift before buyers feel comfortable stepping back in.
For now, all eyes are on $102,100. That's the line in the sand.
 Marina Lyubimova


