 Usman Salis
⬤ Bitcoin is trading around $90,000 while the Bitfinex long to short ratio climbs to its highest reading of the current market cycle. According to market observers, past instances where this metric peaked and began declining were typically followed by strong upside moves in Bitcoin price. The ratio reflects the balance between leveraged long and short positions on the exchange and serves as a sentiment gauge for traders.
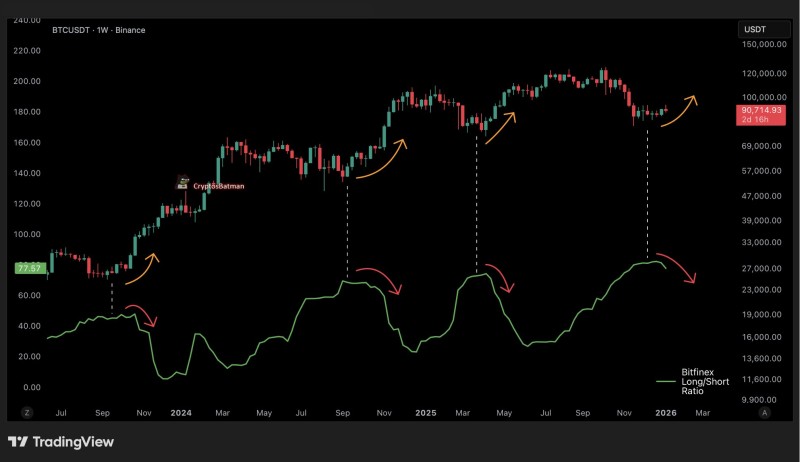
⬤ Looking at previous market phases, there's a clear recurring pattern. The ratio surges to elevated levels, stalls, then starts to decline. These turning points have consistently aligned with the early stages of major Bitcoin rallies, appearing right after consolidation periods. As one analyst noted, "Historical instances where this metric peaked and began to roll over were followed by strong upside moves in Bitcoin price."
⬤ Right now, conditions mirror those historical setups. The ratio has hit an extreme level and is showing early signs of rolling over, just like prior cycle peaks. Meanwhile, Bitcoin price has established a higher trading range compared to earlier phases, with weekly candles consolidating rather than breaking down. The visual relationship between ratio reversals and subsequent price advances is evident across multiple cycles.
⬤ This pattern matters because leverage positioning influences volatility and short-term price behavior in Bitcoin. Extreme readings in long to short ratios often signal shifts in trader sentiment that can precede larger directional moves. With the Bitfinex long to short ratio now at a cycle high and beginning to turn lower, market participants are watching closely to see if Bitcoin follows the historical path observed in previous cycles.
 Usman Salis


