 Eseandre Mordi

Bitcoin is entering a critical technical phase after breaking below important support levels, prompting traders to reconsider the crypto's near-term trajectory. The latest daily chart shows a significant structural shift that's raising eyebrows across the trading community, especially as deeper downside targets come into view.
BTC Structure Shifts Lower Toward Major Support
The chart reveals Bitcoin trading around $96,050, forming a clear downward pattern after dropping out of a multi-month channel that had kept prices relatively stable. This structural breakdown exposes BTC to support levels the market hasn't tested since early summer.
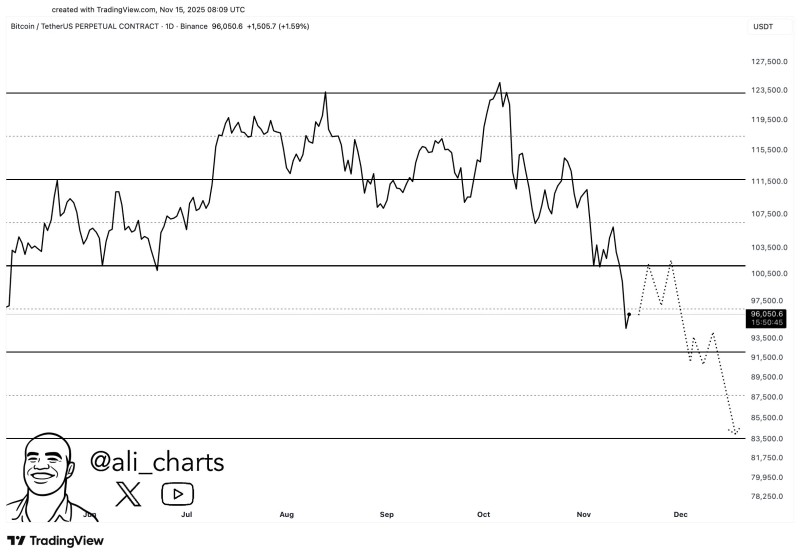
From July through September, price action was mostly sideways, bouncing between major horizontal zones. But once the $103,500 region—which had been holding strong—finally gave way, sellers took control. Since then, Bitcoin's been making lower highs and lower lows, a classic sign that momentum is fading and a return to older demand zones is becoming more likely.
Key Levels to Watch
The chart highlights several important price zones, each representing areas where buyers previously stepped in. Below the current $96,000 level, the next visible supports line up at:
- $93,500
- $91,500
- $89,500
- $87,500
- $83,500 — the main projected target
The projected path shown on the chart suggests BTC might briefly retest the $97,500–$100,500 zone before continuing lower. This potential bounce would be part of normal volatility rather than a sign of reversal.
Technical Outlook Points to Gradual Decline
The structural breakdown supports the view that Bitcoin has opened the door to a move toward $83,500. If buyers can't push price back above the former support around $100,500, sellers will likely keep steering the market toward the lower end of this multi-month range.
 Eseandre Mordi


