 Saad Ullah

⬤ Bitcoin (BTC) is sitting at a critical crossroads, trading near $88,000 as the chart compresses into a narrowing range. The setup is straightforward: a daily close above $89,500 could spark a run toward $100,000, while dropping below $85,000 might send BTC tumbling under $80,000. On Binance, Bitcoin's been hovering around $88,117, caught between a descending trend line and rising support as December winds down.
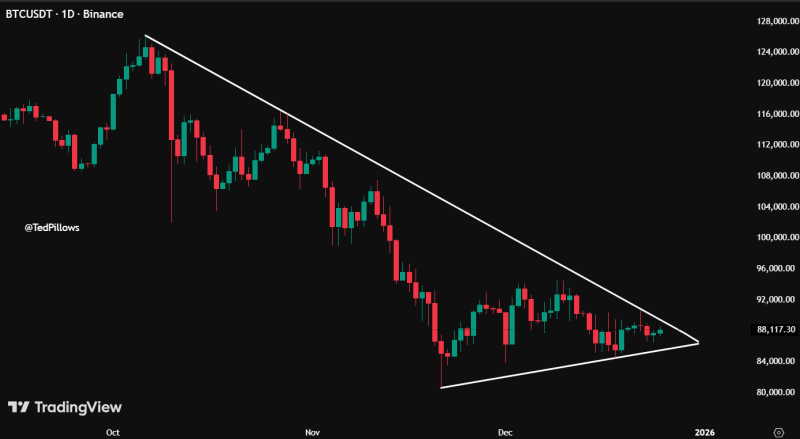
⬤ The chart tells a clear story. For weeks, Bitcoin's been making lower highs under a downward-sloping resistance line while building higher lows along an upward support trend. This classic compression pattern typically means volatility is about to break loose. The first upside target sits at $89,500 on a daily close. If Bitcoin punches through that ceiling, the next stop is $100,000—a level that's been on everyone's radar as both a psychological milestone and a technical marker.
⬤ On the flip side, $85,000 is the line in the sand. A daily close below that support would signal serious weakness and could "dump BTC below the $80,000 zone." Right now, Bitcoin's stuck in the middle, bouncing between these two boundaries while traders wait to see which one cracks first. Recent price action has been pretty quiet compared to the sharp drops earlier this quarter, suggesting the market's coiling up before making its next big move.
⬤ This matters because Bitcoin drives sentiment across the entire crypto market. The clearly marked levels at $89,500 and $85,000 give traders concrete reference points for the short term. Whether BTC breaks higher toward six figures or slips under $80,000 will likely set the tone for volatility heading into the new year.
 Saad Ullah


