Eseandre Mordi

⬤ Bitcoin is sitting at a make-or-break moment on the monthly chart. The price is bumping up against the middle section of a long-term rising channel—a spot that's acted as a turning point before. What happens here could decide whether BTC pushes higher or takes a breather and drops back down.
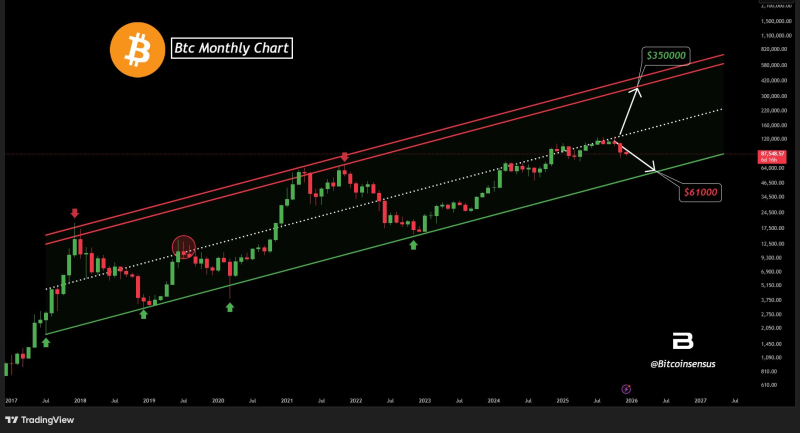
⬤ Right now, the mid-channel resistance is putting up a fight. If Bitcoin gets rejected here, the chart suggests it could slide back to around $61,000. That's not just a random number—it lines up with support inside the channel structure. What makes this interesting is that similar rejections happened back in 2018 and 2021, and both times they led to pretty sharp pullbacks. History doesn't always repeat, but it often rhymes.
BTC at a decision point where the next move will help define whether the current uptrend can extend or whether a deeper pullback develops.
⬤ The bigger picture shows the full channel stretching up to around $350,000 at the top end. That's the long-term ceiling if Bitcoin stays inside this pattern. So there's still plenty of room to run on the upside, but there's also space to fall if the bulls lose control here. The market's sitting in this wide range where both scenarios are on the table—continued climb or temporary retreat.
⬤ This matters because Bitcoin drives sentiment across the entire crypto market. How it handles this resistance will likely ripple through altcoins and influence whether money flows in or out of digital assets. Traders are watching closely to see if BTC can hold its structure or if it needs to retest lower support levels before making another push higher.
 Eseandre Mordi