Usman Salis

Bitcoin's been hovering below a major resistance zone, and traders are watching closely to see which way it breaks.
What the Chart Shows
According to analyst 𝐔𝐌𝐄𝐑 ( THE BULL ), the $115,000 mark has become the line in the sand—cross it, and we could see momentum shift bullish. Stay below, and bears might take control again.
Right now, Bitcoin's stuck in a tight spot:
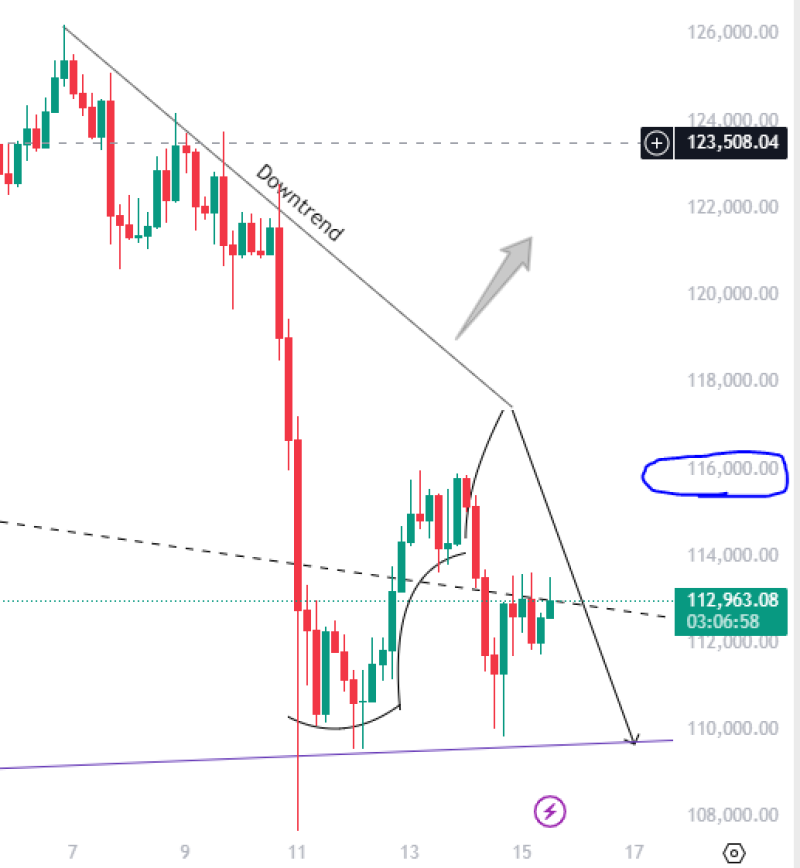
- Resistance overhead: There's a downtrend line that keeps pushing price back down whenever BTC tries to rally
- The $115K–$116K zone: This is the critical level everyone's watching—it's basically the gatekeeper for any real upside movement
- Support around $110K: Bitcoin bounced off this area recently, showing buyers are still stepping in at lower levels
- Two possible paths: Break above $116K and BTC could run toward $123.5K. Fail to break through, and we're likely headed back to $110K or possibly lower
Why It Matters
The $115K level isn't just another number. It's psychologically important to traders, and technically it's where the recent downtrend meets current price action. What happens here will probably set the tone for the next few weeks. Beyond the technicals, Bitcoin's also dealing with broader market jitters—interest rate uncertainty and shifting risk appetite are keeping things volatile.
Bitcoin's at a crossroads. A clean break above $115K would signal strength and open the door for higher prices. Rejection here could mean we're not done testing lower support levels yet. Either way, this zone is likely to produce some decisive action soon.
 Usman Salis