 Peter Smith

Bitcoin might be at a crossroads. After riding a strong rally, the cryptocurrency is now hovering around a level that's proven pivotal throughout its history—the 50-week Simple Moving Average (SMA).
What History Tells Us
According to analyst Ali, every time Bitcoin has lost this support in the past, it's been followed by brutal corrections averaging around 60%. If that pattern holds, we could be looking at a potential slide toward $40,000. But is history really about to repeat itself?
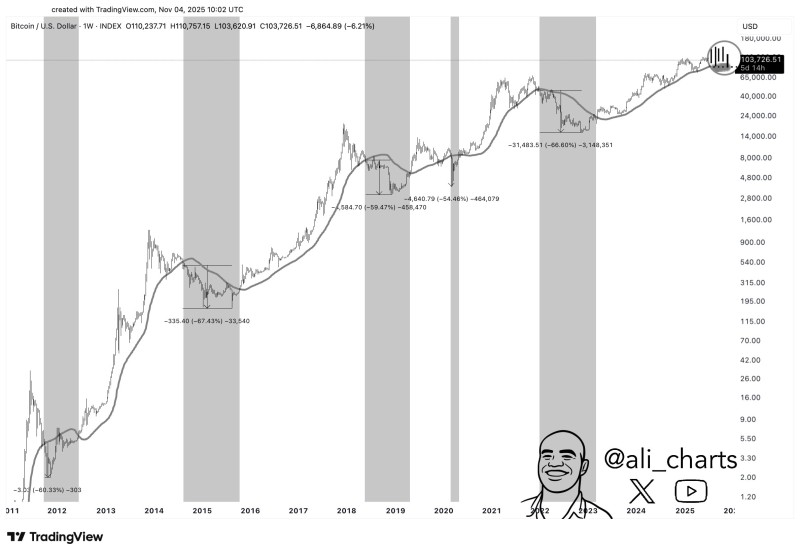
The 50-week SMA has acted like Bitcoin's long-term trendline—a dividing line between bull and bear markets. Looking back over the last decade, the pattern is striking:
- 2011–2012: ~60% drop after breaking below
- 2014–2015: 67% correction during the bear market
- 2018: 59% decline after losing support
- 2022: 66% crash following a failed retest
In every case, Bitcoin didn't find its footing again until it reclaimed that moving average. It's been one of the most reliable signals in crypto.
Where We Stand Now
As of early November 2025, Bitcoin is trading near $103,700—just above the 50-week SMA around $100,000. There was a recent rejection near $110,000, which feels eerily similar to the early stages of past downturns. If BTC loses the $100K support decisively, a 60% drop would put the potential low somewhere around $40,000–$45,000.
That said, today's Bitcoin isn't the same as it was in 2018 or 2022. We've got institutional money, spot ETFs, and even talk of national Bitcoin reserves. These factors could soften any decline or speed up recovery. Federal Reserve rate cut expectations, steady ETF inflows, and post-halving dynamics all add layers of complexity that didn't exist in earlier cycles.
 Peter Smith


