Peter Smith

⬤ Netflix is back in the spotlight after a long-term drawdown chart revealed just how volatile the stock has been over the years. Covering 2002 through January 2026, the chart shows repeated sharp pullbacks despite solid overall gains. Right now, NFLX is sitting about 33.2% below its most recent peak—a drop that's actually pretty typical for this stock's wild ride.
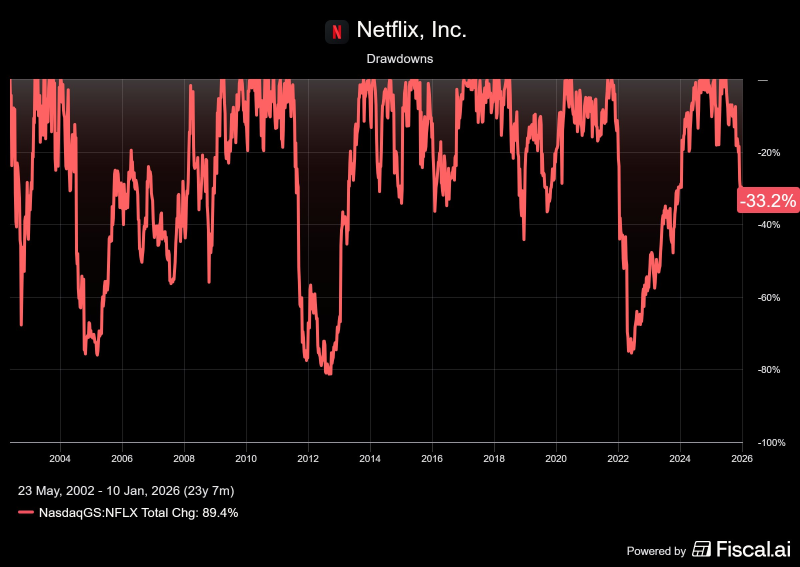
⬤ The numbers tell a dramatic story. Netflix has weathered extreme drawdowns during its lifetime, including a brutal maximum decline of roughly 80% and multiple selloffs exceeding 70%. These massive drops stand out clearly on the chart, with deep valleys appearing during major market stress periods. But here's the kicker: despite all that pain, the stock still posted a total price change of about 89.4% over the full timeframe. Talk about a rollercoaster that somehow ends up higher than where it started.
⬤ Large corrections haven't been one-off events for Netflix—they're the norm. Pullbacks ranging from 30% to 50% pop up repeatedly across different market cycles, proving that sharp declines are just part of how this stock behaves. The current 33.2% drawdown? It's right in the middle of that historically common range, lining up with previous periods where the stock took a breather after strong rallies.
⬤ This pattern highlights how growth stocks work in the real world. Netflix perfectly demonstrates that long-term compounding and frequent severe drawdowns can coexist in the same investment. The historical data shows why volatility tests investor confidence even in household-name stocks, shaping sentiment and expectations through every market cycle.
 Peter Smith