 Usman Salis
⬤ Google (GOOGL) just hit a fresh all-time high this week, extending an uptrend that's been running for nearly two decades. The stock's next technical target sits around $381—the yearly R1 pivot level. What's got traders talking isn't just the breakout itself, but what the momentum indicators are saying about where things might be headed.
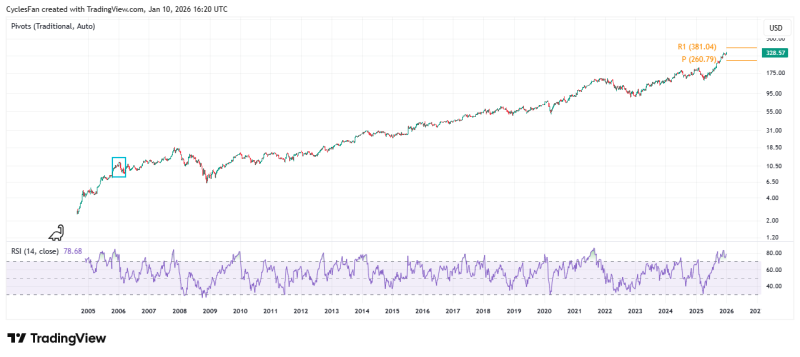
⬤ Here's where it gets interesting: the current RSI setup looks remarkably similar to what happened back in December 2005, when Google was also trading near record highs after a strong run. The stock is pushing new highs while the relative strength index hovers near the upper band, showing powerful momentum that mirrors that earlier period almost exactly.
⬤ But there's a catch. In early 2006, that similar RSI structure led to a divergent top—price kept climbing while momentum started weakening. What followed wasn't pretty: Google dropped roughly 30% between January and March 2006. The current chart shows a similar divergence pattern forming near today's highs. It's not a prediction, but it's definitely a historical parallel worth watching.
⬤ This matters beyond just Google. As a mega-cap tech bellwether, GOOGL often signals broader trends in large-cap technology stocks. A sustained push toward $381 would confirm continued strength in big tech, while this historical comparison highlights how momentum can shift quickly after extended rallies. The setup raises important questions about trend durability and what happens when long-term market leaders hit record territory.
 Usman Salis


