 Usman Salis

Bitcoin's explosive rally through early 2025 has hit the pause button. After months of sharp gains and equally sharp pullbacks, the market is now compressing into a well-defined sideways range. This kind of consolidation usually happens when buyers and sellers reach a temporary standoff—and it often comes right before the next big directional move. The question now: which way will it break?
The Current Range Structure
According to @JesseOlson's weekly chart, Bitcoin's market cap is moving within three key zones:
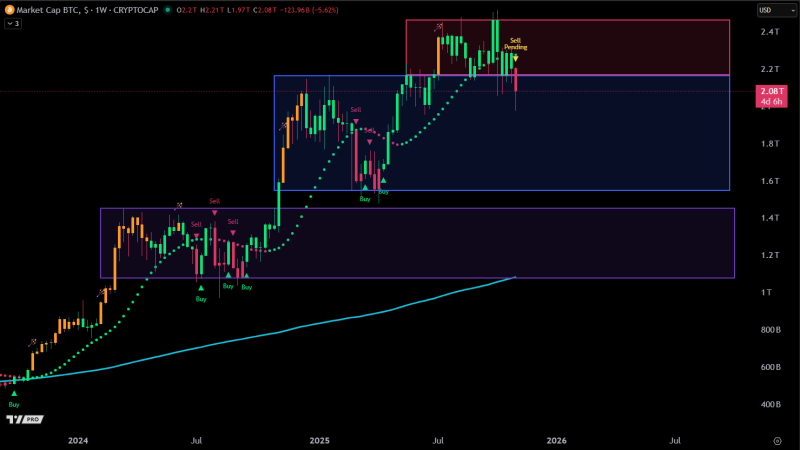
- Upper resistance ($2.2T–$2.4T): Multiple rejections here with "Sell Pending" signals—bulls haven't been able to push through
- Mid-range consolidation ($1.6T–$2.2T): This is where Bitcoin is sitting right now, with the market cap around $2.08 trillion and down about 5.6% for the week
- Lower accumulation zone ($1.0T–$1.4T): The area where buyers loaded up before the 2025 rally kicked off
The Parabolic SAR indicator is showing mild downward pressure, meaning Bitcoin is in a correction phase but not yet in full bearish mode.
What History Suggests
This setup isn't new. Bitcoin's done this before—consolidating in a range for months before exploding higher. Back in mid-2024, a similar sideways grind between $1.2T and $1.6T eventually led to a massive breakout that added over $1 trillion in market value. The chart's buy and sell markers tell the story: accumulation happens at the lows, distribution at the highs. Right now, the "Sell Pending" signal near $2.2T shows traders are cautious and waiting for confirmation.
Macro factors are playing a role too. With global liquidity tightening and the U.S. dollar gaining strength, risk assets like Bitcoin are struggling to push higher. But institutional interest hasn't disappeared, and long-term technicals—like the 200-week moving average—are still trending up. Bitcoin isn't breaking down, but it's not breaking out either. It's resetting, building energy for whatever comes next.
 Usman Salis


