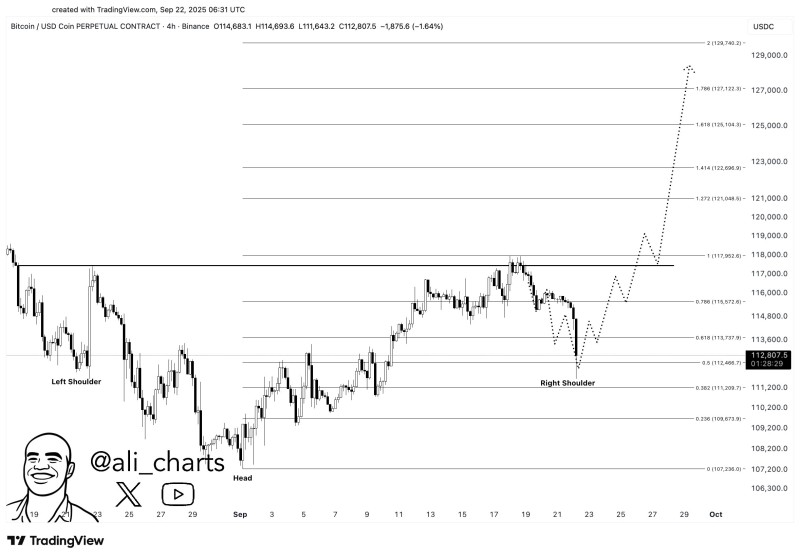
Bitcoin just did something that has traders buzzing. The recent drop to $112,000 wasn't the bearish move some expected – it's actually forming what could be a massive bullish reversal.
The Technical Picture Gets Clearer
Technical analyst Ali spotted it first: we're looking at a textbook inverse head-and-shoulders pattern, and if it plays out, we could see Bitcoin rocket toward $130,000.

Here's what the chart is telling us right now:
- Neckline Resistance at $117,950 – break this and the pattern confirms
- Fibonacci targets stacking up at $121,000, $125,000, and the big prize at $129,000-$130,000
- Critical support holding at $112,000-$113,000 – bulls absolutely need to defend this zone
The pattern itself is textbook stuff. We saw the left shoulder back in late August, the head formed in early September when things looked rough, and now we're building what looks like the right shoulder. It's the kind of setup that gets technical traders really excited because when these patterns work, they tend to work big.
Why This Could Actually Happen
The charts look good, but there's more to it than just lines on a screen. ETF money keeps flowing in, which means the big institutions are still buying. After months of sideways action that had everyone wondering if crypto was done, sentiment is finally turning bullish again. Plus, Bitcoin's been moving with risk assets lately, and if the broader markets can find their footing, crypto could easily outperform.
If Bitcoin can stay above $112,000 and punch through that $118,000 resistance, the path to $130,000 opens up fast. We're talking about a move that would validate not just the technical pattern, but also signal that institutional money is back in a big way. The next few trading sessions are going to be crucial – either this right shoulder holds and we get the breakout everyone's waiting for, or it fails and Bitcoin has to wait longer for its next big run.
 Peter Smith

 Peter Smith


