 Alex Dudov

⬤ Bitcoin's price took a decisive turn downward after failing to maintain its position above the upper boundary of its recent range. The breakdown happened around the $89,000 mark, triggering a rapid move toward lower support levels. The chart shows a clear structural break, followed by accelerated selling once the upper range gave way.
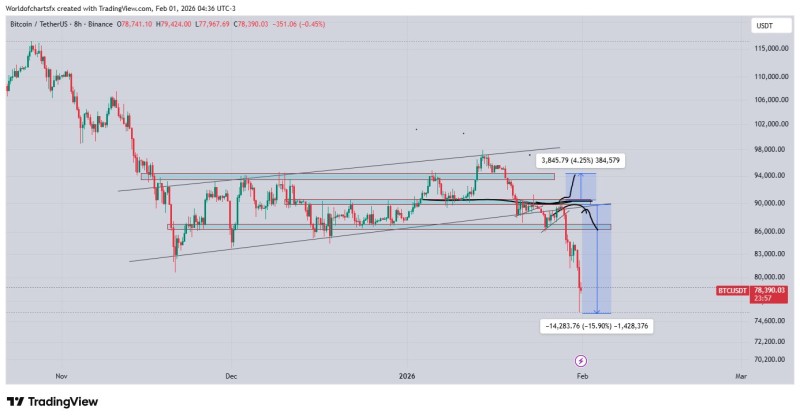
⬤ After the breakdown, Bitcoin moved quickly into the $78,000–$80,000 area, hitting the projected target with precision. The chart reveals a clean rejection at resistance, followed by a nearly vertical drop rather than any gradual consolidation. This sharp move reflects intense selling pressure and confirms that the upper range served as a critical decision point.
⬤ Bitcoin is currently hovering around the $78,000 level, reaching the downside target that was outlined during the initial breakdown. This zone now acts as an important short-term reference point. The price action suggests the decline was driven by technical structure rather than random volatility, highlighting how crucial range boundaries have been in recent Bitcoin trading.
⬤ The speed of this move matters for the wider market—it shows what happens when Bitcoin loses a major support level. The precise landing in the $78K–$80K zone reinforces how technical levels shape momentum and liquidity. What happens next around this area could determine whether Bitcoin stabilizes here or continues its volatile streak.
 Alex Dudov


